Editor’s note: There is a typo in the 2nd paragraph: July 23 should read June 23.
Shares of Tesla (NASDAQ:TSLA) have been screaming higher in 2017. But a recent 2-week swoon has Tesla stock bulls suddenly on their heels.
On July 23, Tesla (TSLA) hit an all-time high of 386.99. Just 2 weeks later, the stock sits at 313.22 (down over 19 percent from those highs set on July 23).
Some perspective: Tesla is still up 47 percent this year!
Let’s turn to the Tesla’s stock chart (see below) to check in on the price action…
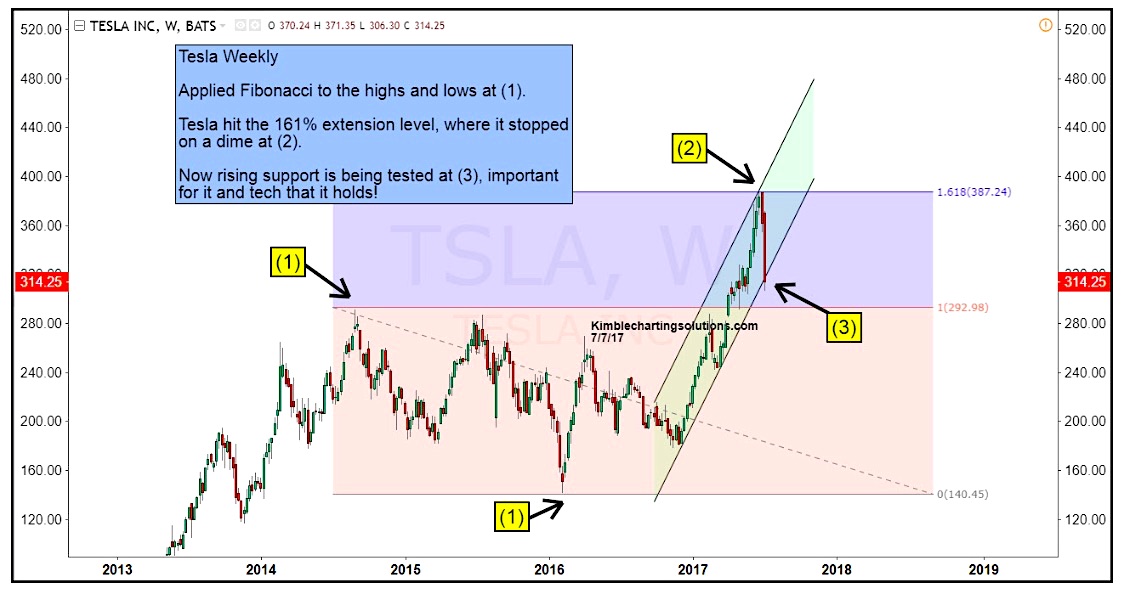
As you can see, Tesla hit a key Fibonacci extension level before heading lower. Using the high of 2014 and the low of 2016, we can project the 161% Fibonacci price target (points 1 & 2). This proved to be powerful resistance.
Tesla is now testing rising channel support (point 3). What happens here will be very important for the stock, in my humble opinion. I think bulls need to make a stand here.
Tesla Stock Chart (TSLA) – From Fibonacci Extension To Trend Line Test
Thanks for reading and have a great weekend.
Twitter: @KimbleCharting
Any opinions expressed herein are solely those of the author, and do not in any way represent the views or opinions of any other person or entity.
: Creating Bullish Divergence?")


 and Semiconductors (SMH): Concerning Price Pattern?")


