The equity market rallied last week with support coming from the familiar theme of soft economic conditions requiring central bankers to keep interest rates low. The latest statement from the Fed was echoed by other central banks that reiterated the need for a continuation of the policy of low interest rates to support economic growth. The S&P 500 Index (INDEXSP:.INX) climbed 1.2% and the Nasdaq (INDEXNASDAQ:.IXIC) for the week. Technology stocks continue to provide leadership. As well, stock market indices for small-caps outpaced large caps last week.
The focus of attention will now shift to the election and third-quarter earnings in October.
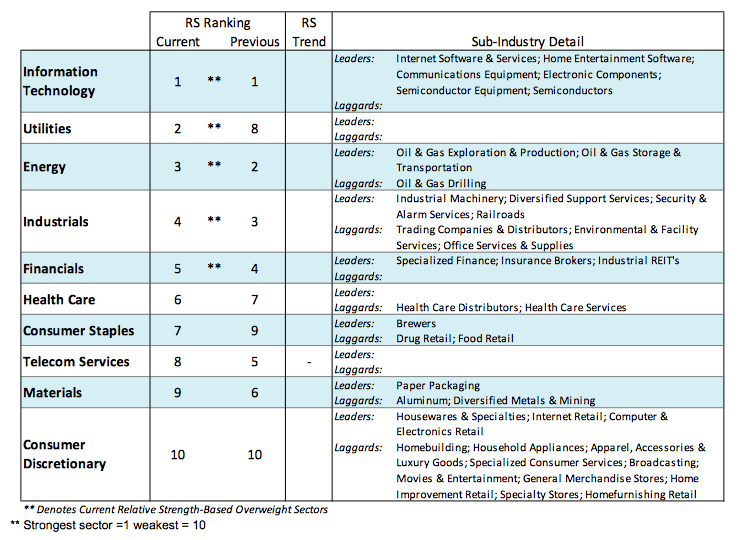
Historically, the stock market trades defensively prior to the election if the race is thought to be tight. Optimism best describes expectations for third-quarter profits, which is far different than the pessimism that was apparent prior to the release of second-quarter results. The strongest sectors in the market include technology and the industrials. These areas have remained resilient during a period of rapidly shifting leadership.
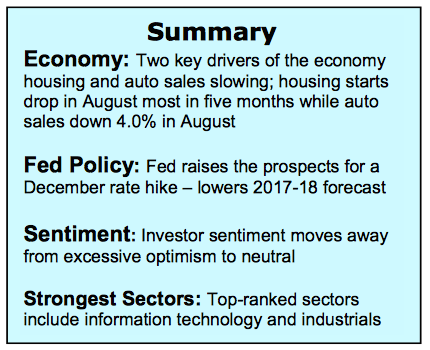
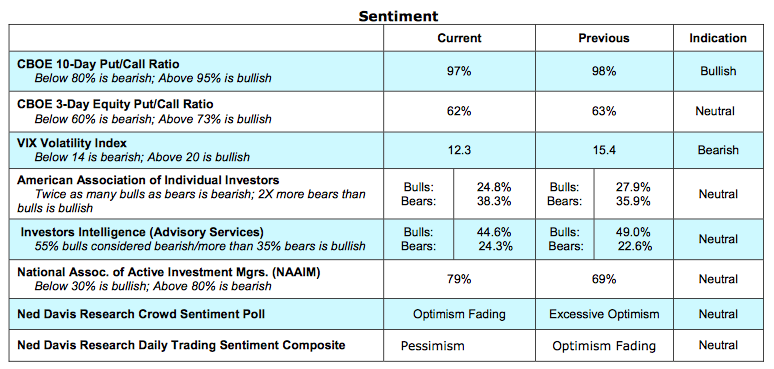
Measures of investor psychology that showed excessive optimism toward stocks in late August have returned to a neutral mode. The latest report from the American Association of Individual Investors (AAII) shows an unusually low level of enthusiasm toward stocks given the close proximity to record highs by the popular averages. Using contrary opinion, this is considered a positive development for the stock market.
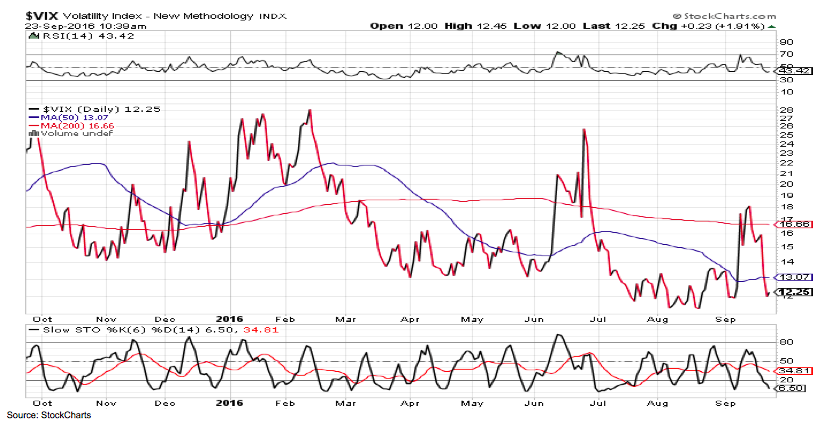
Countering this, however, is fresh data from the National Association of Active Investment Managers that shows a strong propensity toward stocks with an allocation of nearly 80%. The CBOE Volatility Index (INDEXCBOE:VIX) is also a short-term negative for stocks as it indicates complacency on the part of investors. The VIX surged near 19 on September 14, a reading that indicates many are fearful. Eight days later the Volatility Index plunged 33% to 12 erasing all evidence of fear.
Other technical indicators including momentum and stock market breadth are showing modest improvement. The downside momentum, that had been a negative influence on stocks since early September, was broken last week with upside volume exceeding downside volume by a ratio of more than 9 to 1. Market breadth also exhibited some signs of improvement with the expansion of the number of issues making new 52-week highs. But the percentage of industry groups within the S&P 500 with bullish uptrends showed the only a small increase to 69% from 68% the previous week (above 82% would be considered a bullish signal). Overall, the technical indicators are mixed and offer little evidence that stocks could soon break out of the trading range that has persisted since early July.
Thanks for reading.
Twitter: @WillieDelwiche
Any opinions expressed herein are solely those of the author, and do not in any way represent the views or opinions of any other person or entity.


")

 Ready To Break Out?")

