The Technology Sector (NYSEARCA:XLK) is being hit hard for reasons well beyond investors control. Investors are attributing the election, Trump himself, and other outside of the box influences. In reality nothing is clear. Therefore the best thing to do is look at the charts to see what’s next for technology stocks.
The Technology sector makes up nearly 21% of the S&P 500, therefore its next move is significant for broader markets.
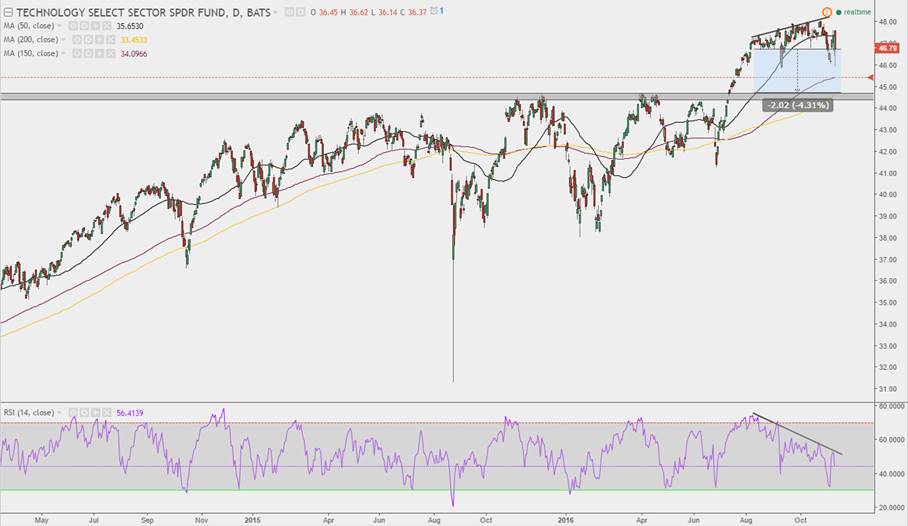
Heading into the election the Technology sector was already presenting some signs of weakness (relative to the broader stock market). Price was producing new 14 year highs, however price momentum measured by RSI (relative strength index 14 day) was diverging. As the divergence continued, the sector as a whole was becoming more and more susceptible to price weakness.
That is what happened, but the question should now turn to, when will it stop?
The answer is never clear, but the $44.60 shaded level seems like a logical place to find support. This was the key resistance level back in late 2015, and once again throughout the early portion of 2016. The July breakout led to a 7% gain in the sector but we must consider that the breakout level was never re-tested for confirmation. For your knowledge, $44.6 is roughly 4% away from the current price. Therefore, anyone viewing this weakness as a buying opportunity should focus around the $44.60 level (and keep their wish-lists handy). And remember that patience and discipline are virtues for active investors.
Technology Sector (XLK) Daily Candle Chart
You can catch more of my market insights on my site, The Market Meter. Thanks for reading.
Twitter: @_SeanDavid
Any opinions expressed herein are solely those of the author, and do not in any way represent the views or opinions of any other person or entity.

: Cup (and Maybe Handle) Watch")
 Trading Near Top Of Price Range")

