Some traders/investors like to use fundamental analysis while others like to use technical analysis. What fundamental analysis doesn’t show traders or active investors is where to buy and sell. You buy and hold.
Using a variety of tools available in technical analysis, shows traders and active investors, where to buy and sell.
Think of it this way: Fundamentals are based on what might happen, and technical analysis is based on what IS happening.
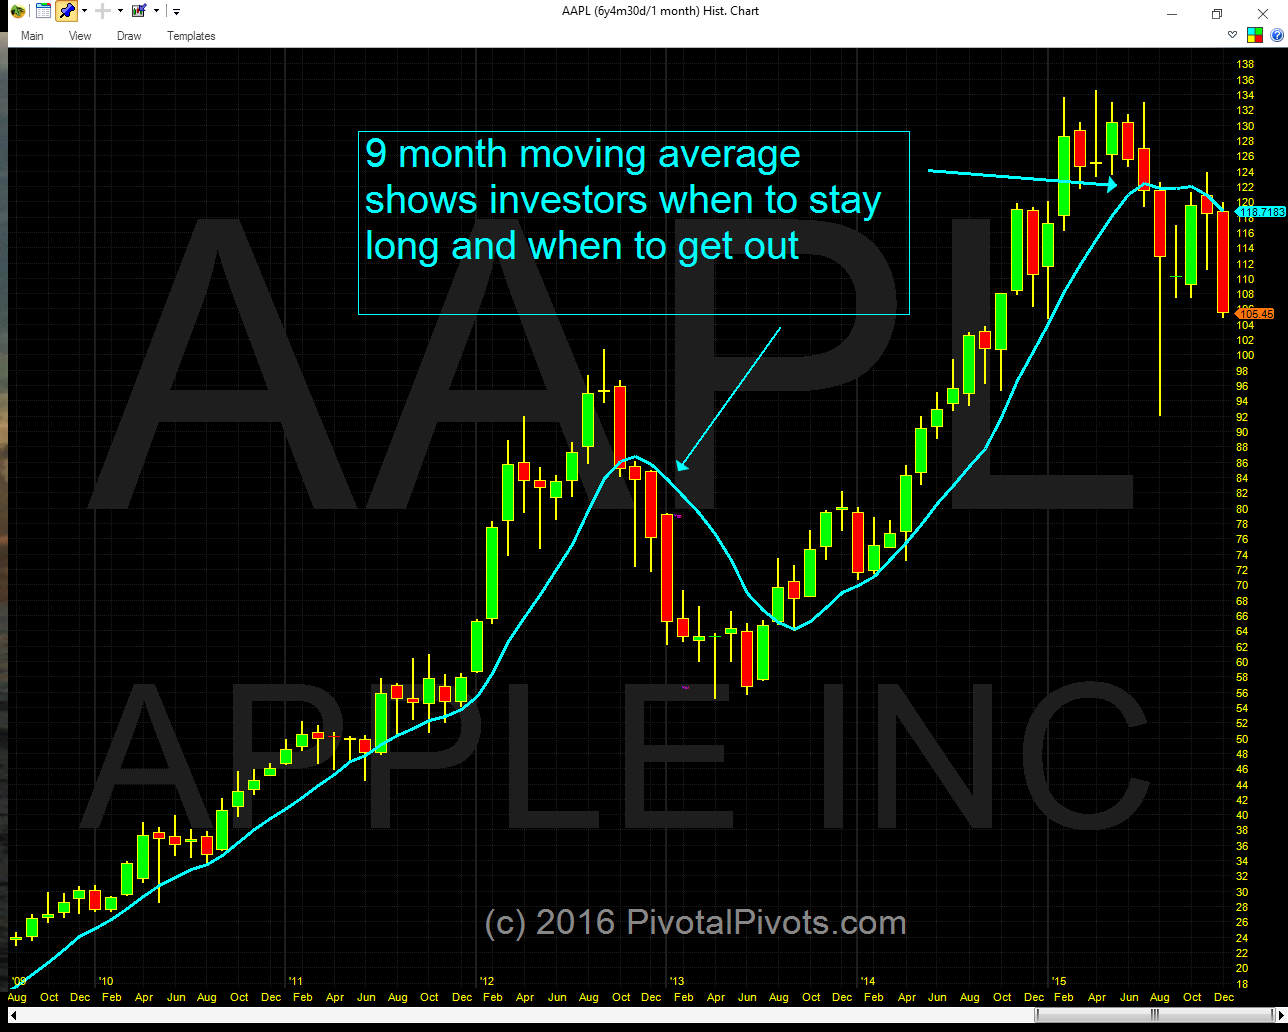
One technical analysis tool is simple moving averages. The past several years, using a monthly chart with a 9 period moving average, has shown Apple (AAPL) active investors when to stay long and strong, and when to get out.
Apple (AAPL) Stock Chart – with 9 month moving average
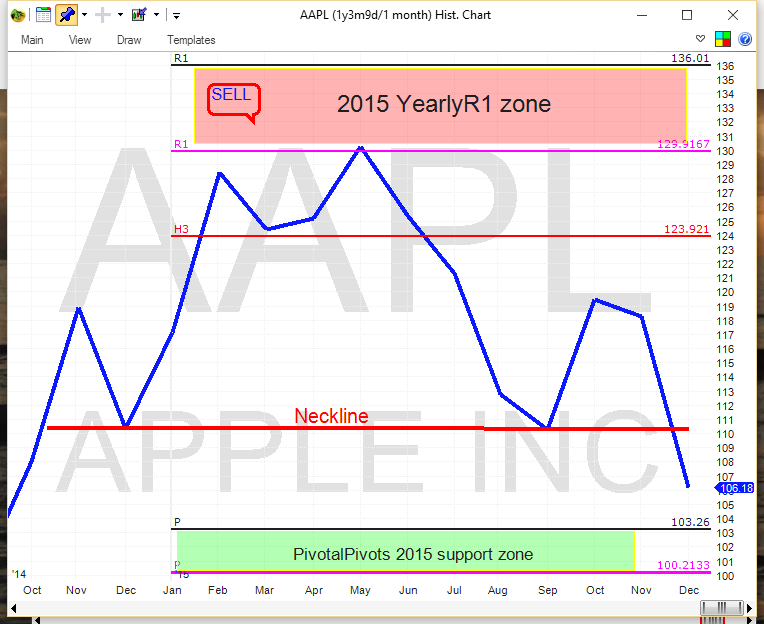
Another tool that I use and have referenced here before are called Yearly Pivot Points. It’s a forward looking indicator vs a lagging. Yearly Pivot Points shows where computer algorithms are buying and selling.
My favorite is when I see a distinct technical pattern at the Pivot Points.
As I wrote back in November, Apple was making a Head and Shoulders pattern, right at the 2015 YearlyR1 pivot. As of the close of 2015, the Head and Shoulders pattern is now confirming.
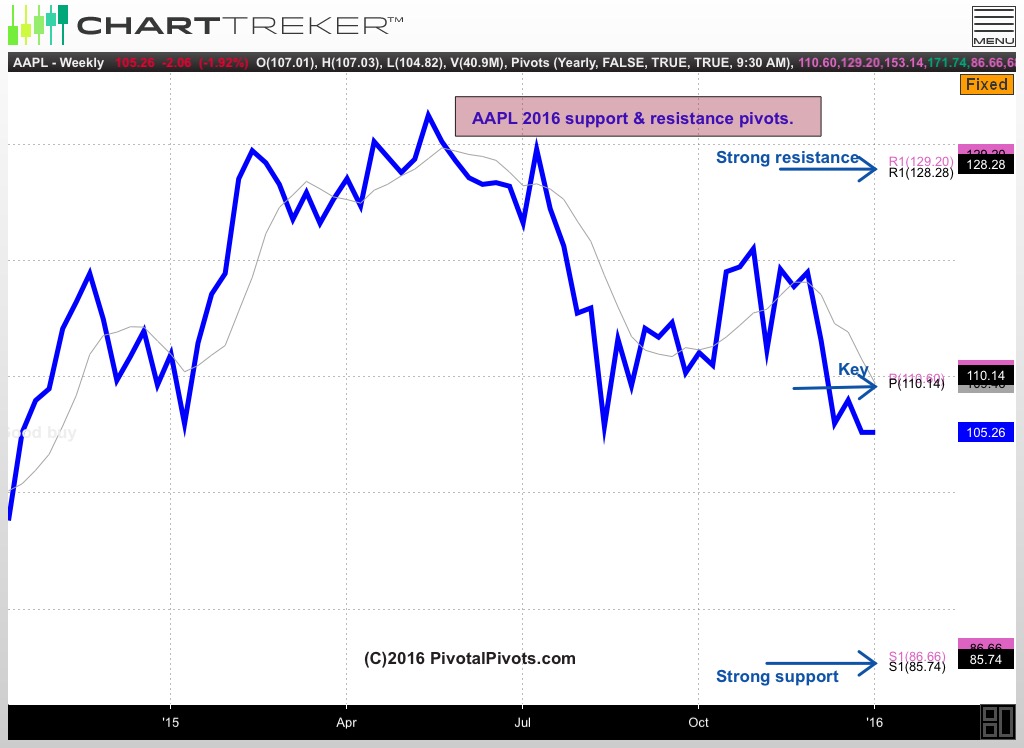
The 2016 Yearly pivot points suggest downside risk will be to the 2016 YearlyS1 pivot @ $86 and next resistance will be at the 2016 Yearly(P) at $111.
Best to your trading in 2016!
Twitter: @Pivotal_Pivots
The author does not have a position in any mentioned securities at the time of publication. Any opinions expressed herein are solely those of the author, and do not in any way represent the views or opinions of any other person or entity.

: Showing Some Signs of Emerging Strength")
