It’s very common for markets to have a pullback. It’s also fairly common for markets to have a correction. Throughout time we’ve dealt with common downturns, and less common “major” downturns. But that’s all a part of what makes a market.
But there’s more.
Since the 1929 stock market crash, every major market top has occurred at a Yearly resistance pivot. That’s right, Yearly Pivot Points are responsible for stalling Mr. Market at some important .
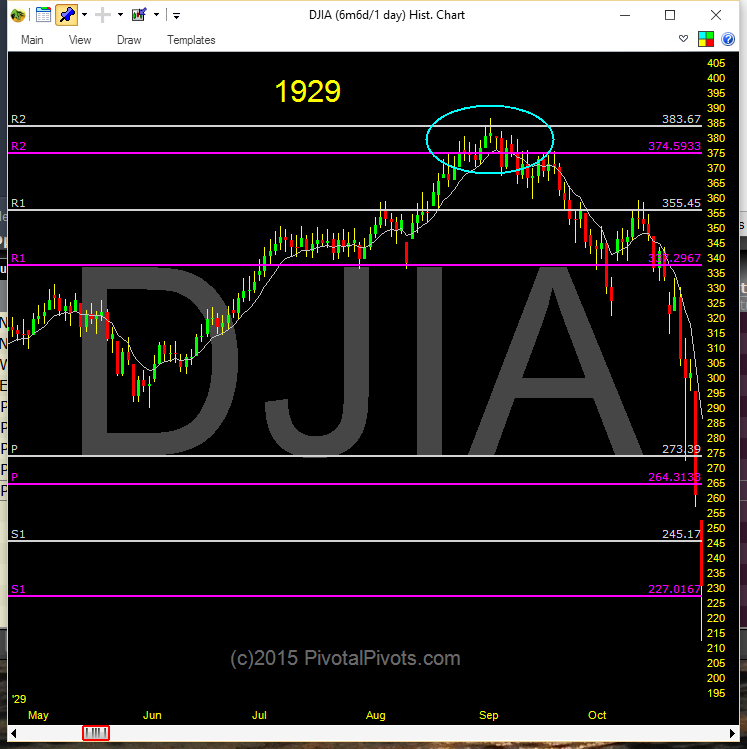
In 1929 it was at the Yr3 pivots.
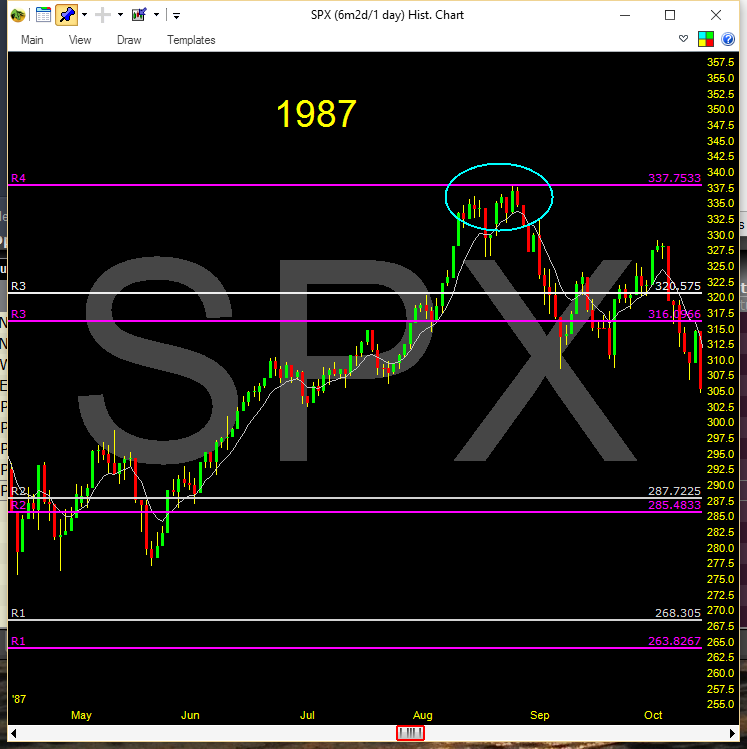
In 1987 it was the Yr4 pivots.
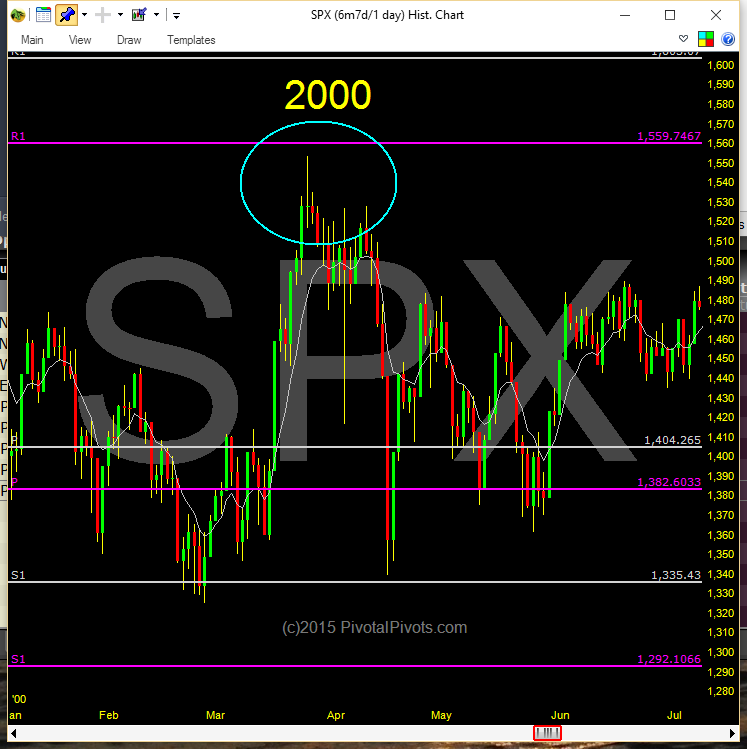
In 2000 it was the Yr1 pivots.
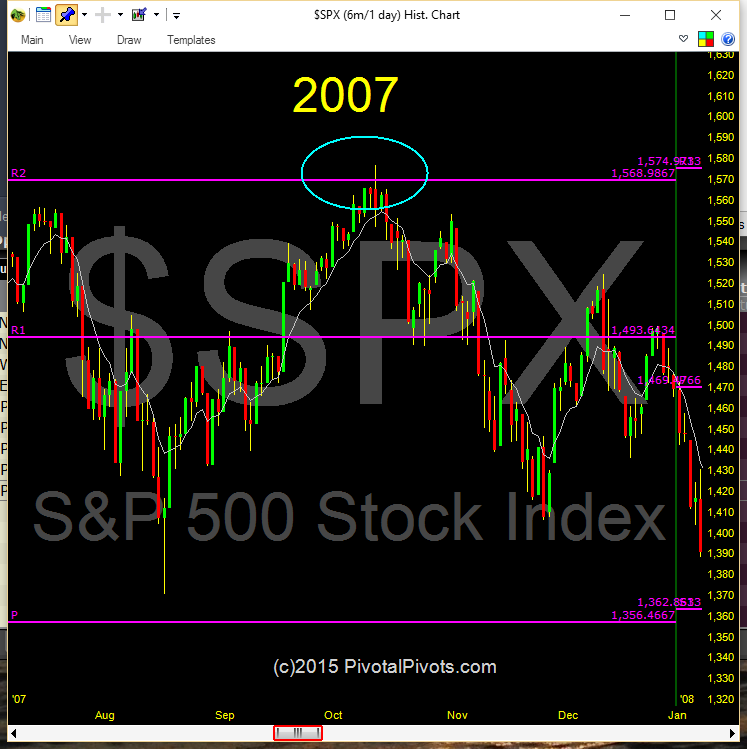
And in 2007 it was at the Yr2 pivots.
Coincidence? I think not! Professional traders and investors have been using pivot points for almost 100 years! If you want to know where the market or a stock may top or bottom, it’s important to understand (and use) the Yearly Pivot Points.
Let’s have a look at some notorious stock market tops… you’ll notice each turning point came near the yearly pivot points.
1929 Stock Market Crash – Dow Jones Industrial Average (DJIA)
1987 Stock Market Top – S&P 500 Index (SPX)
2000 Stock Market Top – S&P 500 Index
2007 Stock Market Top – S&P 500 Index
This past spring I did a 1/2 day webinar on how to use Pivot Points. I recorded the webinar and it is on special for the holidays at PivotalPivots. Learn more about pivots on all time frames, whether it’s yearly pivot points or daily pivot points.
Thanks for reading and have a great week.
Twitter: @mpgtrader
Any opinions expressed herein are solely those of the author, and do not in any way represent the views or opinions of any other person or entity.


