Imagine this scene for tech stocks.
Shares of Apple (AAPL) fighting to hold above $100. Shares of Alphabet/Google clawing their way back toward $750. And shares of Amazon (AMZN) scaling a steep wall back toward $600. And that’s after a big Nasdaq rally.
That’s the current setup.
On one hand, this sounds pretty pathetic considering that these large cap tech stocks once traded at much higher levels: AAPL at $134, GOOGL at $810, and AMZN at $696.
Yet, on the other hand, it’s important to understand that all three have (along with many other tech stocks) rallied back from much deeper depths hit in February. AAPL has rallied back from $93, GOOGL $682, and AMZN from $474.
These are just examples. And no, they don’t represent a broad view of tech-land. HOWEVER, they do go hand in hand with the sharp Nasdaq rally we’ve seen.
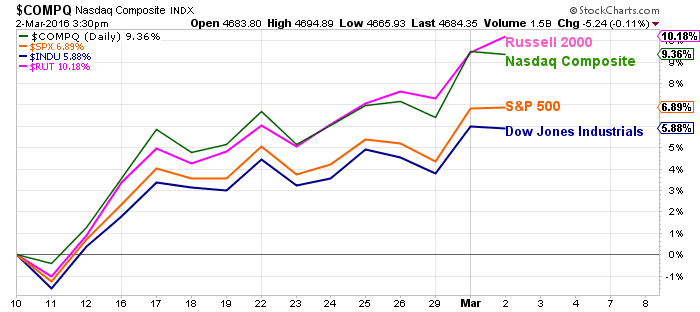
And when you couple the success of large cap tech stocks with the success of small caps, you get a nice rally. On February 11, the Nasdaq Composite bottomed (18.68% off of it’s December 2, 2015 highs). Since then, the Nasdaq and the Russell 2000 have lead the way, up 9 and 10 percent respectively.
Stock Market Indices Performance Chart
This type of “risk-on” price action is what bulls want to see. HOWEVER, this type of price action also makes for great selling into overhead supply.
So what does that mean? It means that the Nasdaq rally is likely to let it’s foot off the gas pedal into overhead resistance levels. For active investors (and traders), further strength in tech land could offer an opportunity to raise capital by trimming positions.
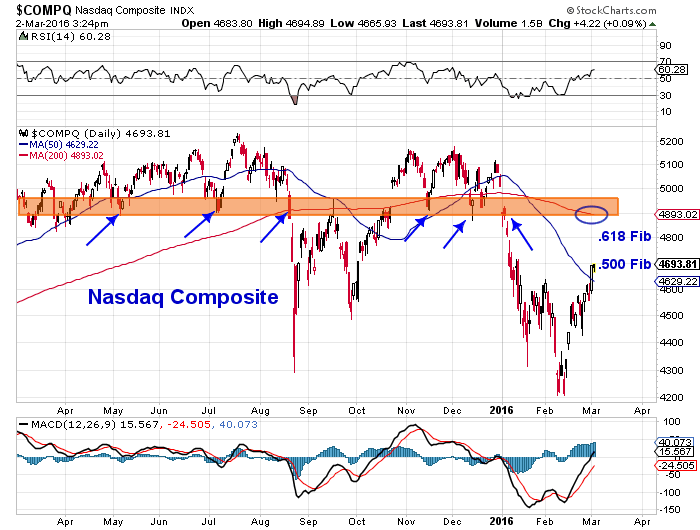
More specifically, there are 4 key overhead levels to note (see chart below for reference):
1). The 50 percent Fibonacci retracement of the December 2 high to February 11 low is 4693… roughly where we stand right now.
2). The next resistance level is the 61.8 percent Fibonacci level at 4807. That’s a little over 2 percent away (and a likely target near-term).
3). The 200 day moving average is at 4893. That’s roughly 4.2 percent away and would be a secondary target.
4). Massive overhead supply zone between 4875 and 5000.
As of right now, many are speculating that this is simply a bear market rally. But in all fairness, nobody knows for sure if this is a bear market rally (that will give way to new lows) or a thrust off the lows in a new developing range. Either way, if the market wants to go higher, it has to get through these levels.
Looking at the chart, we can see that the 200 day moving average is downsloping. At the same time, the 50 day moving average is trying to flatten out. That usually means that the 200-day will be tough to overtake upon initial attempt, and that the 50-day may be retested at some point (and provide a bigger battle).
All in all, the Nasdaq rally has pushed the index up over 9 percent off its recent lows. It appears to have roughly 2 to 5 percent upside near-term (into the confluence of overhead resistance). That type of action tells me that its probably time to start focusing on taking some profits/raising some capital into further strength. Just my two cents.
Nasdaq Composite 1 Year Chart
Thanks for reading.
Further reading from Andrew: “This Isn’t The Stock Market You Imagined“
Twitter: @andrewnyquist
The author holds exposure to related securities at the time of publication. Any opinions expressed herein are solely those of the author, and do not in any way represent the views or opinions of any other person or entity.

: Showing Some Signs of Emerging Strength")
