Tech stocks have been leading the bull market higher since the market bottomed in 2009.
As investors we become concerned when leaders start to show weakness.
Well, with Amazon, Google, Facebook, and several other big tech stocks pulling back it’s clear why we are seeing heavy selling and a correction in the NASDAQ, NASDAQ 100, and major tech sectors.
However, as we can see in the chart below, the price action should have given us pause at the turn of the month (or initial sign of weakness).
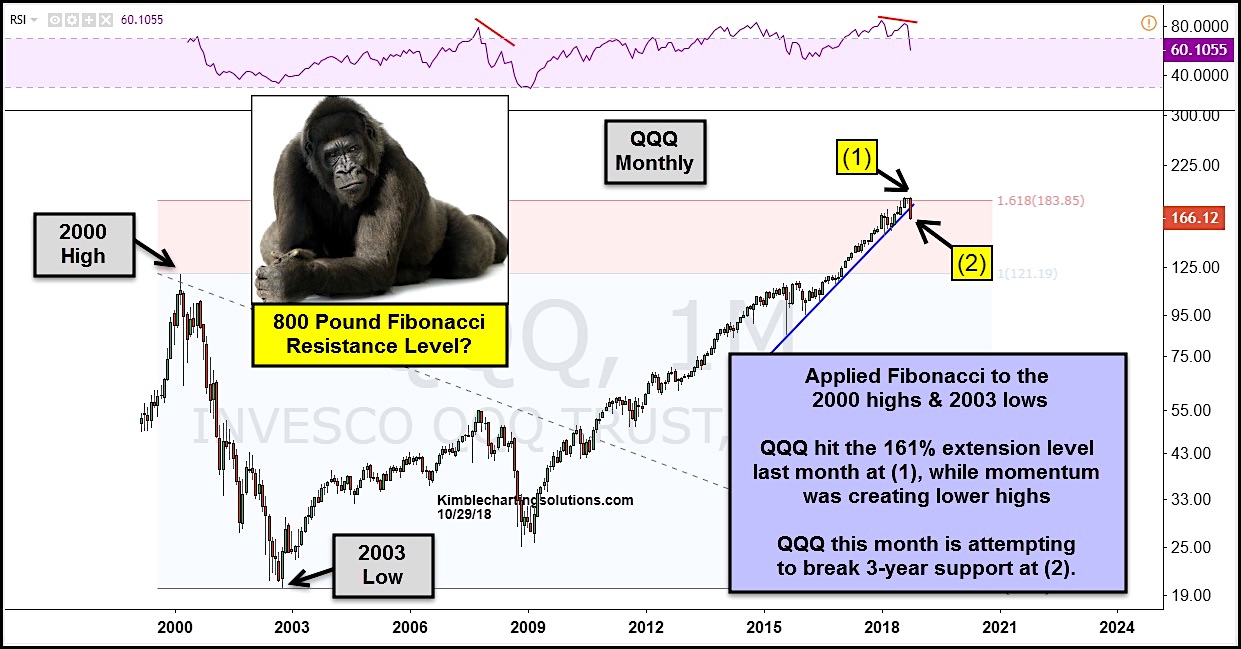
That’s because the NASDAQ 100 ETF (QQQ) had hit its 1.618 Fibonacci extension level (using 2000 highs and 2003 lows). See point (1).
The QQQ’s hit the 1.618 Fib resistance level last month (1). And at the same time it recorded a lower high in momentum (see the upper panel) – a bearish divergence.
The QQQ’s are now in a correction and the “monthly” candle is attempting to break 3-year trend line support (2).
Stay tuned!
$QQQ PowerShares Nasdaq 100 ETF “monthly” Chart
Note that KimbleCharting is offering a 2 week Free trial to See It Market readers. Just send me an email to services@kimblechartingsolutions.com for details to get set up.
Twitter: @KimbleCharting
Any opinions expressed herein are solely those of the author, and do not in any way represent the views or opinions of any other person or entity.
 Trading Near Top Of Price Range")
 Reaches Important Price Support")
