 Tech stocks have been the embodiment of momentum in 2013, posting nearly 30% gains YTD. But as we witness yet another push higher, it’s likely time for some caution: A short-term trading top is likely this week.
I say this for a few reasons:
1) The charts are overbought (don’t be so obvious!)
2) DeMark daily and weekly sell setups are aligning
3) The US Dollar is nearing support and may be setting up for a bounce
4) The S&P 500 appears to be “following the script.” It is on bar 9 of a daily sell setup today and within the 1645-1660 target I recently pointed to.
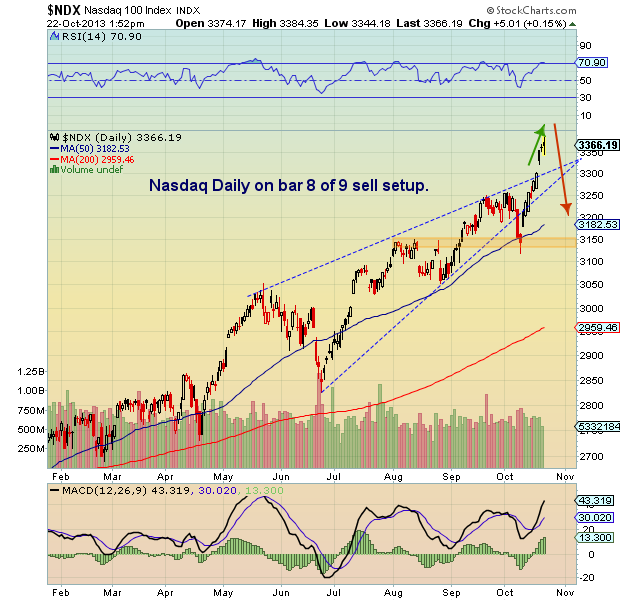
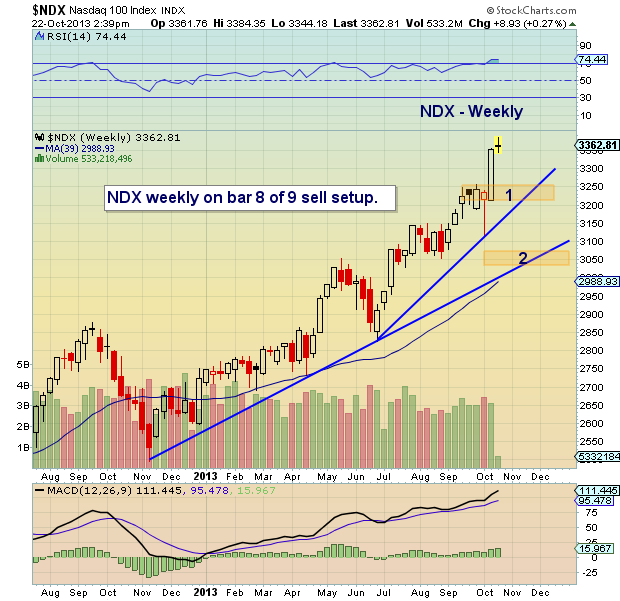
I refer to this as a trading top, because the price action after a high (short or intermediate term) are really what matters. That said, let’t turn to the charts. Note that I am using the Nasdaq 100.
On the daily chart, the pattern may be setting up for a pendulum reversal back through the apex. This pattern possibility is set up by the recent breakout above rising resistance and would be confirmed by a break back through it (to the downside). Note this has not happened as of yet, but is something to keep on your radar. The daily sell setup is on bar 8 of 9. This could produce a short term reaction lower over the next week. And this reaction could receive some extra oomph from the weekly sell setup that is set to record next week (also on bar 8 of 9). All in all, this could apply pressure on tech stocks over the next 2 to 3 weeks. 3225-3250 is first support area, followed by 3050-3075.
As always, trade safe, trade disciplined.
Nasdaq 100 Daily Chart
Nasdaq 100 Weekly Chart
Twitter: @andrewnyquist
No position in any of the mentioned securities at the time of publication. Any opinions expressed herein are solely those of the author, and do not in any way represent the views or opinions of any other person or entity.


 and Semiconductors (SMH): Concerning Price Pattern?")


