With so many investors laser-focused on the megacap leadership in Technology (NASDAQ:QQQ) and Consumer Discretionary (NYSEARCA:XLY), an unlikely sector is beginning to show signs of strength:
Consumer Staples (NYSEARCA:XLP)
With Consumer Staples quietly hitting another 13-week high this week, this defensive sector is beginning to outperform Consumer Discretionary with further upside in sight.
The Consumer Staples sector has underperformed the S&P 500 index since early 2016. The XLP was in a consistent uptrend in 2016-2017, yet other sectors put in stronger gains over the period.
After the market topped in January 2018, the XLP pulled back further than other sectors, continuing to underperform.
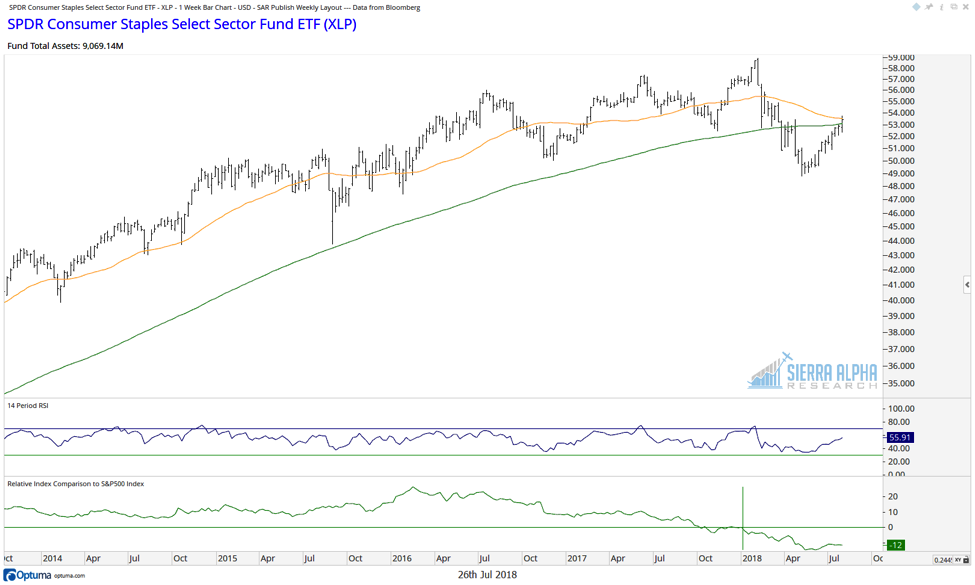
As the MANIA names held up well in the first half of 2018, the XLP consistently found lower lows until it finally found a bottom in early May.
Since then, the Consumer Staples sector has rallied quickly, recovering almost 50% of its 2018 drop. The XLP has now reached its 200-day moving average for the first time since February.
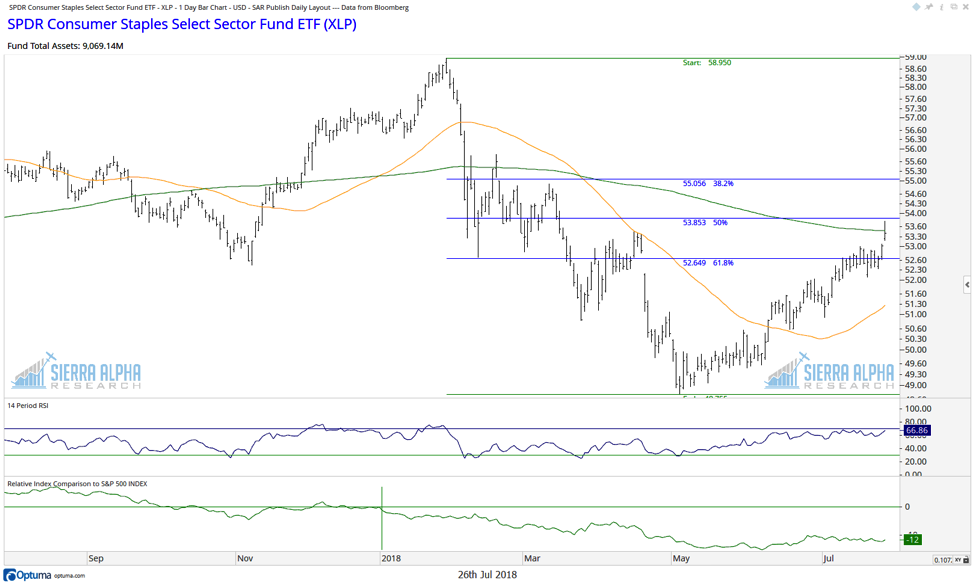
If the XLP has a confirmed break above the 200-day moving average, this should clear the way for further upside with 55 as a first objective.
How does this compare to Consumer Discretionary?
The XLY has been in a consistent uptrend since the 2015 market correction, outperforming the S&P and driven by the strength of megacap names. However, two observations on the daily chart suggest some caution in the coming weeks and months.
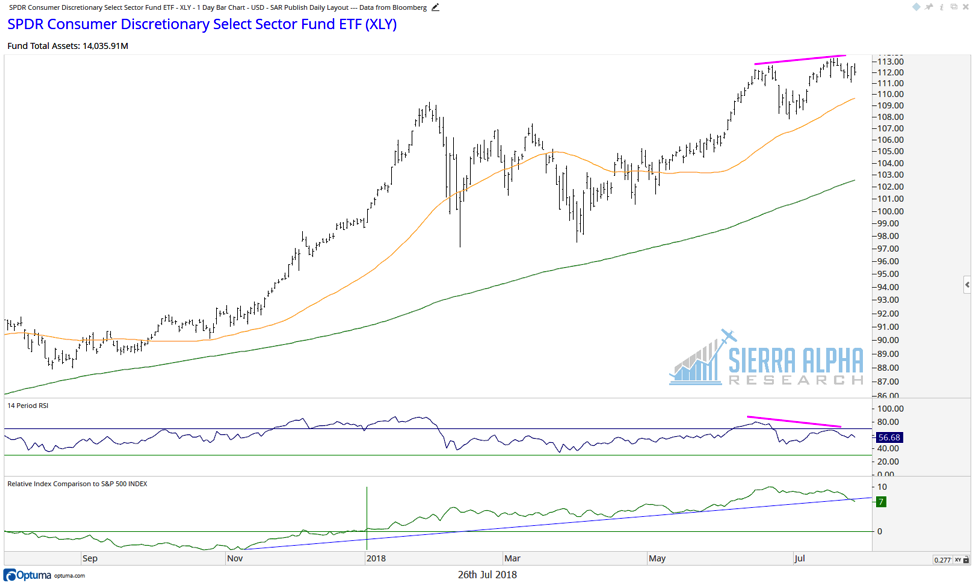
First, we have a bearish divergence with price and the 14-day RSI. This suggests weakening momentum and often leads to short-term downside for price.
Second, the relative strength line has broken down a trendline using the 2018 lows. This illustrates that while some Consumer Discretionary names have held up well, other sectors are starting to show more near-term strength.
Perhaps the most concerning chart is a ratio of Consumer Discretionary to Consumer Staples. I often refer to the XLY/XLP chart as an indicator of where to rotate within the consumer space, as well as a big picture signal of offense vs. defense.
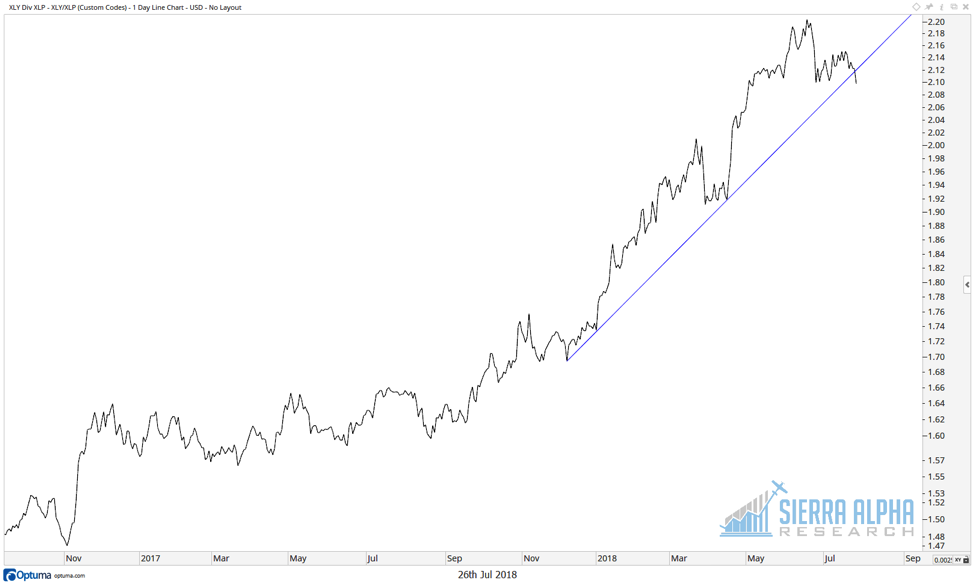
This ratio has now broken a trendline using the 2018 lows. While this could be just a short-term breakdown followed by a resumption of the multi-year uptrend, it’s worth following to see if the ratio continues lower.
When was the last time Consumer Staples started to underperform Consumer Discretionary for a meaningful amount of time? Late 2015, when the S&P corrected about 13%.
For now, this relative breakdown by Consumer Discretionary should put these two sectors on your radar for potential further rotation.

: Showing Some Signs of Emerging Strength")
