 The past couple weeks have seen stocks put in a short-term top and key reversal day, followed by a lot of treading water around an important Fibonacci support level. Although the damage is minimal thus far, the elevator down can be painful if you aren’t prepared. Therefore, it is good to check in and keep tabs on key levels of support and resistance. In this instance, I am monitoring Fibonacci support levels, trend lines, clusters, and moving averages.
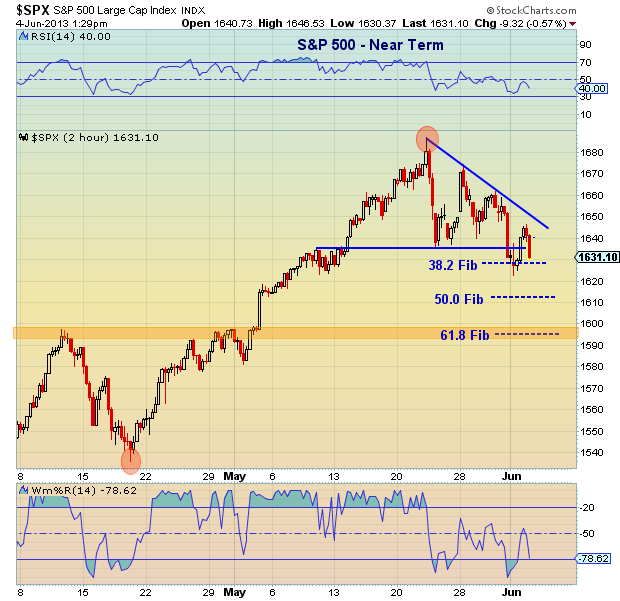
Let’s start with an inside out approach. First, let’s look at the near-term, a 2 month chart of the S&P 500. Here we can focus on the recent wave up and Fibonacci support levels (retracements lower). As of the time of this writing, the market trying to hold the .382 Fibonacci support level. Should this give way, the .500 Fibonacci support level will be waiting at 1612, followed by stronger support at the .618 Fibonacci support level around 1595-1600. The latter is also the breakout level and near the 50 day moving average and uptrend line (see next chart).
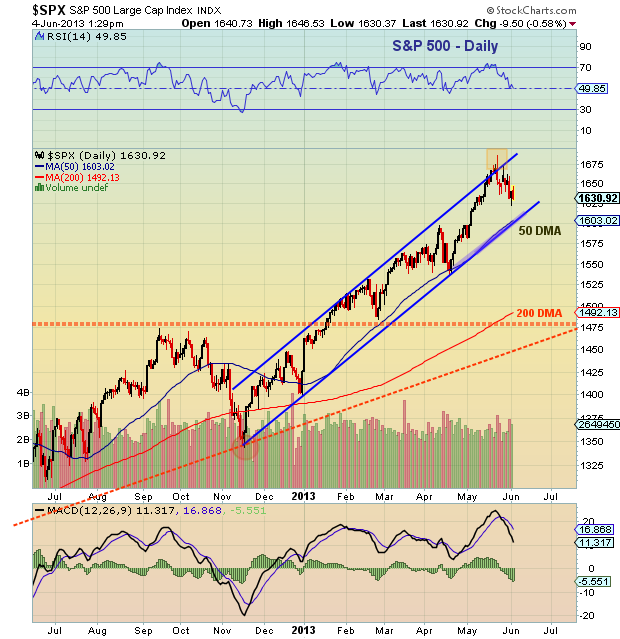
Now let’s zoom out and move to a wider lens – a one year chart. Herein, you can see the tight channel that the stock market has been in since last November. The uptrend line and 50 day moving average are key supports from a macro level (around 1600). Should this level break down, the .382 Fibonacci retracement of the November to May uptrend would come into play at 1556. This would then be followed by the .500 Fibonacci support level at 1515, and lastly the .618 at 1475.
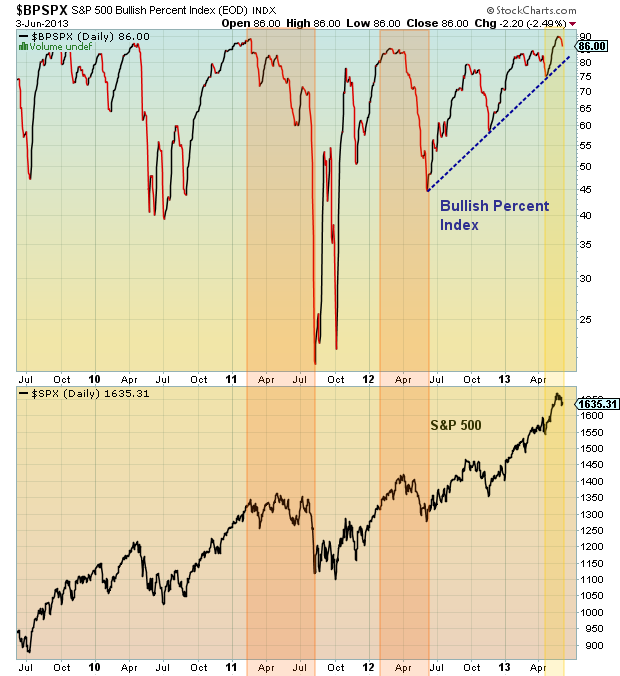
 I’ll leave you with one final chart to ponder: the S&P 500 Bullish Percent Index. This index is a breadth indicator that highlights the number of stocks within an index that are on point and figure buy signals. The indicator tends to flash caution between 70 and 80 and outright concern above 80. The indicator recently hit 90. It has turned lower, but is still holding the uptrend line. A move below 80 would be bearish for stocks.
Thanks for reading. Trade safe, trade disciplined.
Twitter: @andrewnyquist and @seeitmarket
Author has a position in SH at the time of publication.
: Creating Bullish Divergence?")

 and Semiconductors (SMH): Concerning Price Pattern?")
 and Semiconductors (SMH): Concerning Price Pattern?")


