Key Takeaways – Global Equities:
1. Downside risks in the stock market have not abated.
2. Global trends are weakening as Emerging Markets equities (NYSEARCA: EEM) have declined in wake of rising trade tensions.
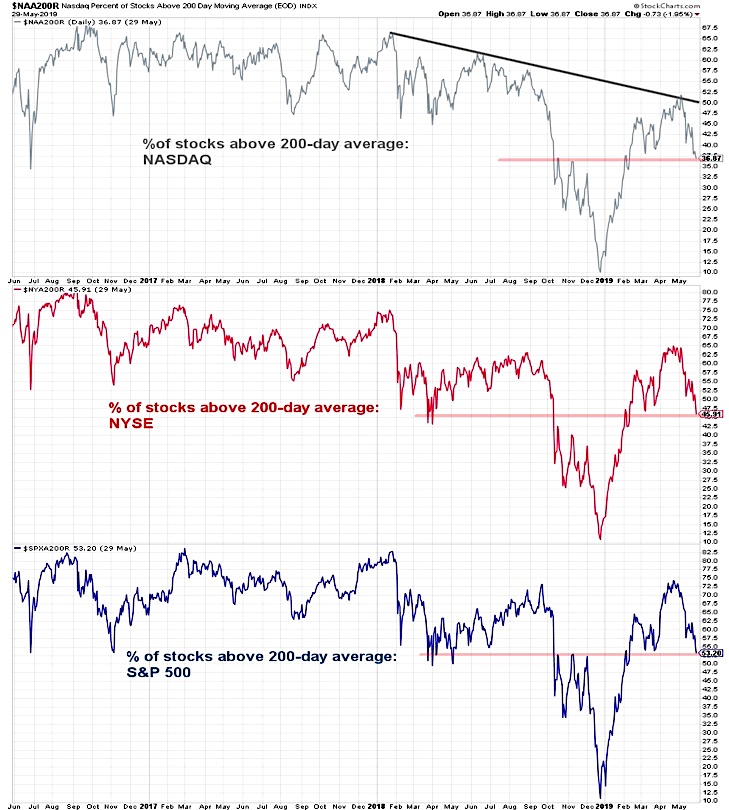
3. Domestically, stock market breadth deterioration continues to be seen at the individual stock and sector level. See “breadth” chart showing S&P 500 (NYSEARCA: SPY), Nasdaq, and NYSE.
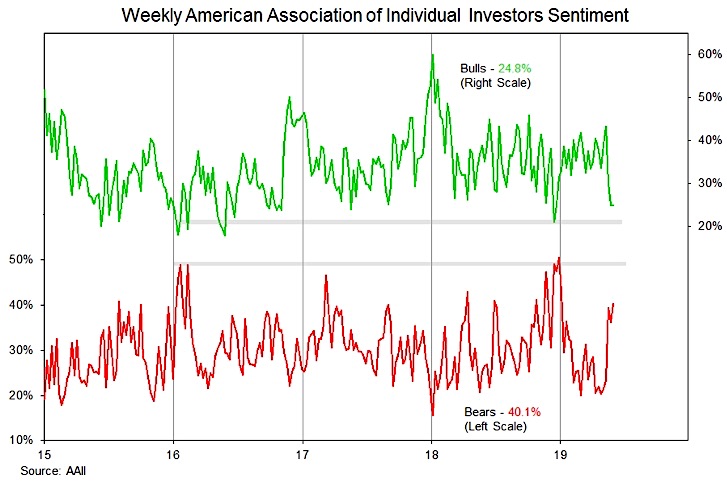
4. Investor sentiment is shifting but remains shy of suggesting excessive pessimism.
While there are pockets of resiliency (Australia, Brazil and India are all in positive territory for May), overall global stock market trends show signs of weakening. This reinforces last week’s message that downside risks are on the rise.
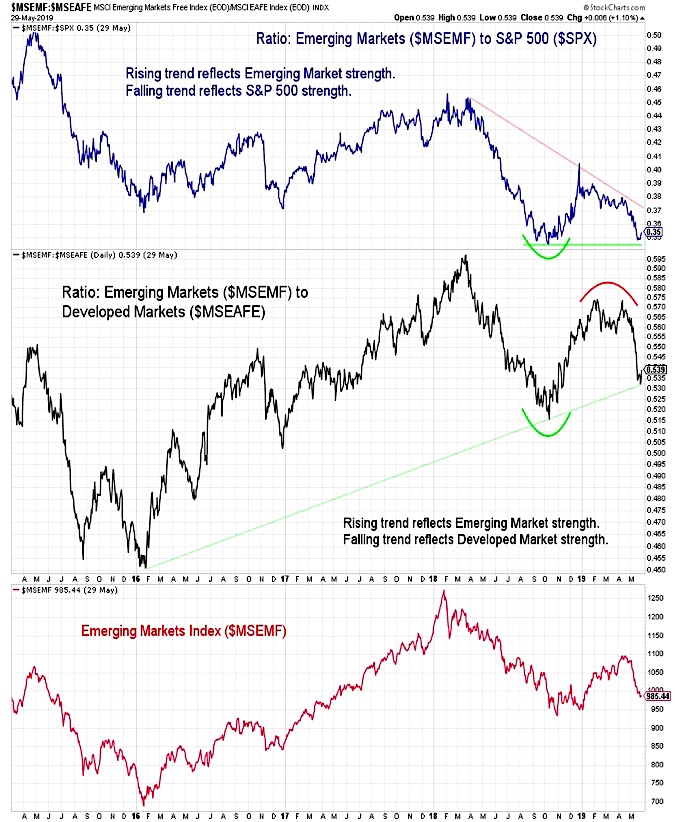
One of the early signals that stocks were poised to rally in the wake of fourth-quarter weakness was the strength shown by Emerging Markets, on an absolute basis, but also relative to both the S&P 500 and the EAFE. The Emerging Market Index made a higher low in December as a prelude to the early-2019 strength. That price improvement has been difficult to maintain as tentative improvements in the global economy have become suspect in the wake of rising trade tensions.
After peaking in late-2018, emerging markets have given back all of the relative price improvement gained versus the S&P 500. After peaking in April on an absolute basis and relative to Developed Markets, Emerging Markets have rapidly approached their late-2018 lows. New lows by Emerging Markets on an absolute or relative basis could have negative implications for stocks in other parts of the world.
Another perspective on global rally participation comes from looking at the percentage of markets above/below their 200-day averages and the percentage of markets with 200-day averages that are rising/falling. Global stocks, as measured by the MSCI ACWI (All-Country World Index), peaked in January 2018.
The rally in US stocks heading into the fourth quarter of 2018 was accompanied by fewer markets trading above their 200-day averages and fewer with 200-day averages that were rising. Early-2019 strength saw a surge in markets trading above their 200-day averages, though that has since reversed. While the percentage of markets with 200-day averages that are rising had been expanding, it failed to get above the 50% threshold and has now stalled out.
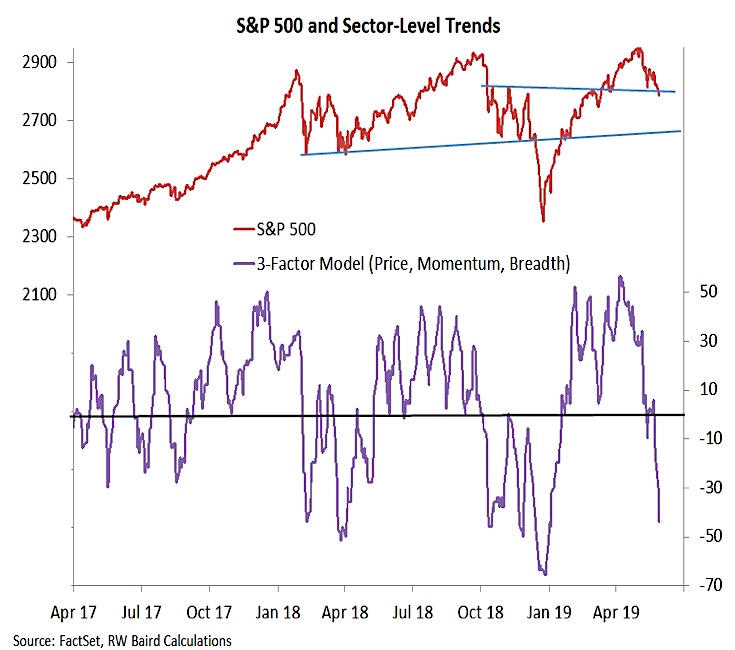
The deterioration in global trends echoes the weakness being seen in sector-level trends within the S&P 500. Our composite indicator of sector-level price, momentum, and breadth trends (updates and details for this are included in our weekly Market & Sector Trend Summary report) has turned sharply lower over the past week. By failing to stabilize near zero and expanding into negative territory this indicator suggests trends at the sector level are weaker than what is being seen by just looking at the index. With breadth indicators continuing to lead the way lower, downside risks have not been abated. Rallies in the S&P 500 could be hard to sustain until this indicator gets decisively back into positive territory.
Sector-level trend deterioration is consistent with weakness being seen among individual stocks. With overall price trends rolling over, our focus has shifted from the new high list and measures of optimism to a more acute concern with the new low list and measures of pessimism. On both a daily and weekly basis, the new low list continues its slow expansion – pointing to weakness but not capitulation.
We also continue to watch the percentage of stocks trading above their 200-day averages. The rebound in these breadth measures in the early going of 2019 was impressive, and was actually recovering ahead of price. That leadership was short-lived and breadth has lagged over the past two months. On the NASDAQ, NYSE and the S&P 500, the percentage of stocks above their 200-day averages has now pulled back to the levels seen in February, undercutting the March lows. The S&P 500, which is just over 5% below its all-time high, looks increasingly out of step with the breadth data (only 53% of S&P 500 stocks are even above their 200-day averages).
While there is some evidence of elevated fear and concern on a short-term basis (demand for put options has soared and the NDR Trading sentiment composite is in the pessimism zone), it is not yet widespread. Investors Intelligence bears remain below 20% and the NAAIM data has not shown a widespread shift to more defensive positioning. The AAII data has probably seen the biggest shift in sentiment, but we probably need to see bulls near 20% and bears near 50% to indicate pessimism has become excessive.
Twitter: @WillieDelwiche
Any opinions expressed herein are solely those of the author, and do not in any way represent the views or opinions of any other person or entity.


