The equity markets rallied last week breaking a two-week losing streak. The S&P 500 (INDEXSP:.INX) and Dow Jones Industrials (INDEXDJX:.DJI) gained 0.7% while the Russell 2000 Index climbed 1.45%.
Investors have seen an uptick in stock market volatility (INDEXCBOE:VIX) in August. And from the early action this week, that news theme may carry forward (especially in light of the situation in North Korea).
Stocks found support from a technically oversold condition – this was particularly true for small-cap issues that had been under selling pressure since late in July. The bounce in the equity markets has also been supported by reports of progress on tax relief which could happen before year end.
Following last week’s action, the large-cap stock market indices remain in close proximity of their highs. The picture for the average stock, however, is very different. Despite last week’s gains, more than 50% of S&P 500 issues are trading below their 50-day moving averages and nearly 40% are trading below their 200-day moving averages. Since late July, volume has contracted on all rallies, which is a symptom that the demand side of the equation has been significantly diminished. For a clear signal that the current weakness has run its course we would need to see a substantial increase in volume. One or two sessions where upside volume exceeds downside volume by a ratio of 10-to-1 or more would offer strong evidence the consolidation/correction cycle has run its course.
A host of economic data will be released this week including second quarter GDP on Wednesday, and the August jobs data on Friday. Analysts expect second quarter GDP to be revised to 2.7% from 2.6%. Consensus estimates are that the economy generated 175,000 jobs last month with the unemployment rate unchanged at 4.3%.
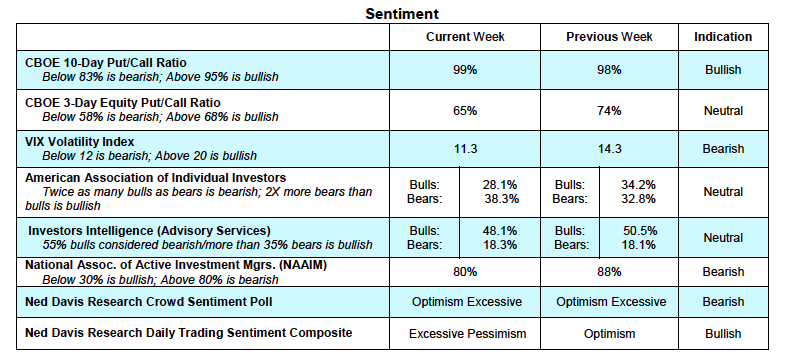
Measures of investor sentiment show the excessive investor optimism found in late July slowly being squeezed out, which could allow for a short-term rally. The latest data from Investors Intelligence (II) show less than 50% bulls, down from 60% earlier in the month. The most recent survey from the American Association of Individual Investors (AAII) showed more bears than bulls last week. The fact that Wall Street letter writers and individual investors are turning more cautious is a favorable development using contrary opinion. Professional investors, however, continue to assume an aggressive posture toward stocks. The latest report from the National Association of Active Investment Managers (NAAIM) shows active managers’ allocation to stocks at an aggressive 80%. The best rallies have occurred when all groups are in the same investment mood. This would require the NAAIM allocation to stocks to fall below 60%.
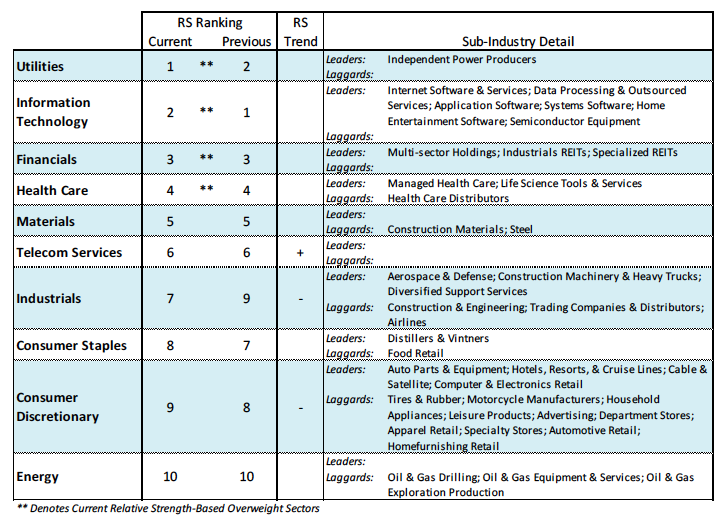
Stock market breadth continues to deteriorate and remains the largest weight on the market. In a healthy bull market nearly all areas are in harmony, which is not the case in the present example. The percentage of industry groups within the S&P 500 dropped to 57%, down from 77% in July. Should the groups in uptrends fall below 50% it would reinforce the prospects that the current decline has more room on the downside. Support for the S&P 500 is in the vicinity of 2375 to 2425 with resistance at 2465.
Thanks for reading.
Twitter: @WillieDelwiche
Any opinions expressed herein are solely those of the author, and do not in any way represent the views or opinions of any other person or entity.


