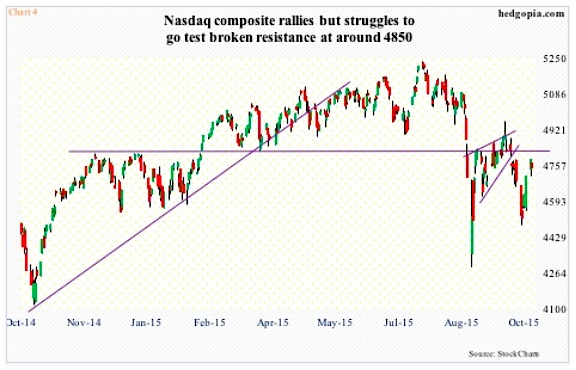
On the Nasdaq Composite, 4850 has been an important price point going back to November last year. The index (4748.36) first broke out of it in February, and held above, until the vicious August sell-off. Post-August 24th low, it went on to retake that level, only to lose it again. This time around, it is struggling to even get near that resistance. Sellers are showing up earlier (Chart 4). Bio-techs once again are hurting.
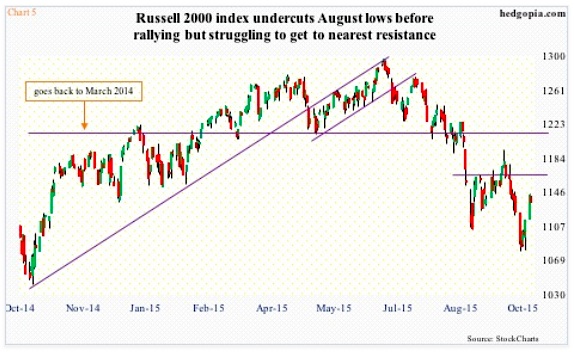
As relates to the Russell 2000 Index, during the post-FOMC sell-off in the second half of September, it was the only one of the major U.S. indices to have undercut the August lows. It managed to rally six percent from the September 29th low, but that was not enough to bring the small cap stocks index to the nearest resistance – at 1160ish (Chart 5). The falling 50-day moving average is right above, at 1167.55.
From the bulls’ perspective, the good thing is that on all these stock market indices, and others, shorter-term averages are either beginning to rise or flattish. But the real one to watch is the aforementioned resistance.
Staying with the S&P 500, only when 1990ish is conquered would we probably see short-covering in earnest on stocks. We need some genuine buying, not just FOMO, for that to happen.
Thanks for reading!
Twitter: @hedgopia
Read more from Paban on his blog.
No position in any of the mentioned securities at the time of publication. Any opinions expressed herein are solely those of the author, and do not in any way represent the views or opinions of any other person or entity.


