ODDS MORE FAVORABLE FOR BREAKOUT ATTEMPTS
A recent Short Takes post covered setups for the broad stock market. This post covers similar setups in tech and growth stocks. Note that the term setup speaks to probabilities.
TECH DAILY
There are several positive setups on the chart of the Vanguard Information Technology ETF (VGT) below, telling us patience over the past four months may be on the verge of being rewarded with higher highs and higher profits. Even if the bullish setups prove to be helpful over the coming weeks, we should always expect red days and normal backfilling.
VGT Daily Chart – higher low… breakout to higher high
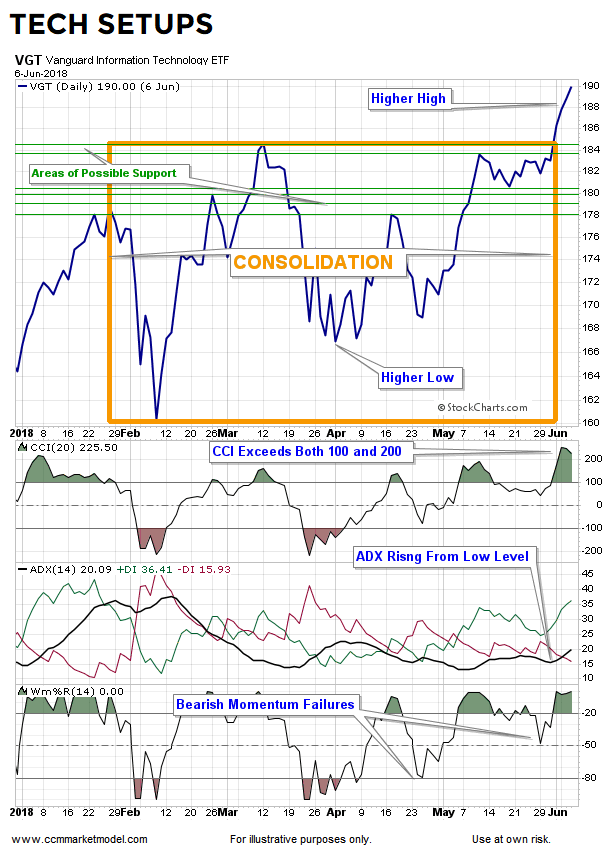
The annotations are described in more detail below:
From a price perspective, VGT recently cleared the highs made in March (orange box). Since tech has run up quite a bit in a short period of time, the thin green lines represent areas of possible support if the market wants to perform a retest.
According to stockcharts.com, “As a coincident indicator, CCI surges above +100 reflect strong price action that can signal the start of an uptrend… the majority of CCI movement occurs between -100 and +100. A move that exceeds this range shows unusual strength or weakness that can foreshadow an extended move.” The fact that CCI hit 100 and 200 after price cleared the top of the orange box tells us it may be a sign of strength rather than an excessively overbought reading – time will tell.
When black ADX drops to low levels and sits below both red and green, it indicates a trendless, sleepy market. When ADX black starts to rise from below both red and green, it can indicate the start of a new trend. The setup is in place; now ADX black needs to complete the turn, which falls into the TBD category.
A May 7 Short Takes post highlighted “bearish momentum failures” that told us to be open to a push higher in stocks. Similar bearish momentum failures are present in Wm %R on the VGT chart above. According to StockCharts.com, “The failure to move back into overbought or oversold territory signals a change in momentum that can foreshadow a significant price move.” In short, the bears have been unable to establish much downside momentum over the past eight weeks, which is in stark contrast to the previous eight weeks.
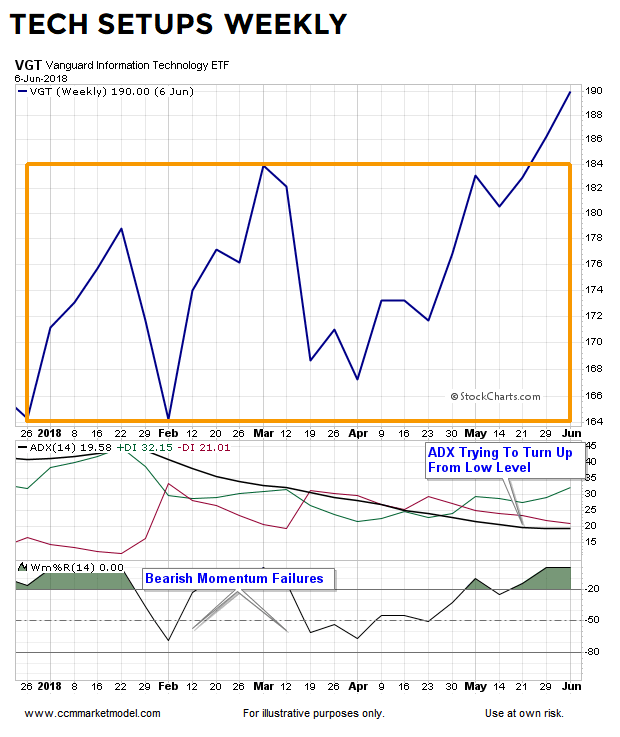
TECH WEEKLY
Similar constructive setups on the weekly chart of VGT tell us to be open to an extended push higher rather than assuming a resumption of the recent bout of sideways movement.
VGT Weekly Chart
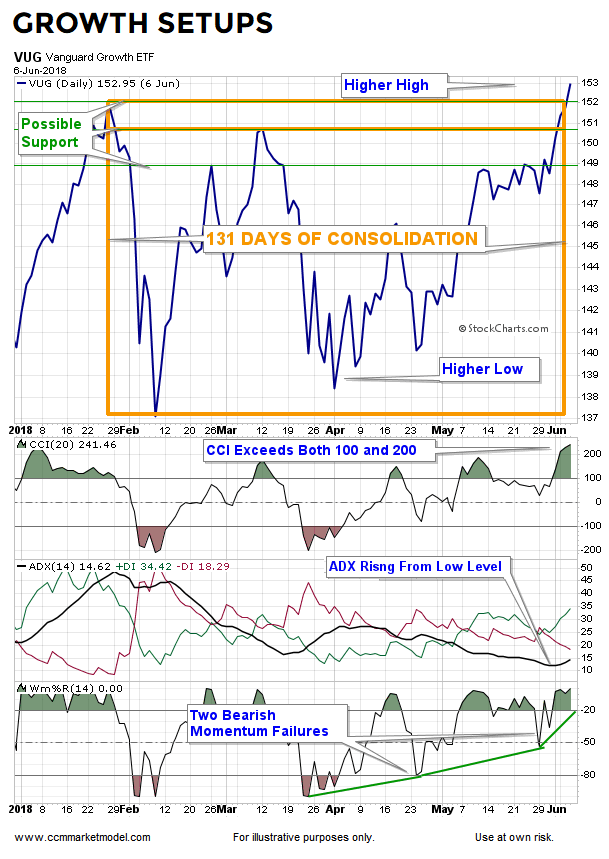
GROWTH DAILY
The chart of the Vanguard Growth ETF (VUG) also has similar constructive probability setups.
VUG Daily Chart
MORAL OF THE STORY
The terms odds and probabilities are significantly different from the terms certainty and forecast. The charts and indicators above tell us it is possible we are moving from a harder market to what could be an easier market.
Since we have held our winning positions during the recent correction, the developments outlined above do not change much from a game-planning perspective. We will continue to take it day by day, remaining open to all outcomes.
Twitter: @CiovaccoCapital
The author or his clients may hold positions in mentioned securities at the time of publication. Any opinions expressed herein are solely those of the author, and do not in any way represent the views or opinions of any other person or entity.


