It is that time of year again when funds hold on to and add to stocks that are winners while selling losers (i.e. window dressing). From a technical perspective, both bullish and bearish trends can set up tradable continuation opportunities.
These are opportunities that astute technical traders can take advantage of if prepared to do so. Our homework helps us to identify stocks with solid the trading setups.
We prepare for opportunities via a simple process wherein the DAILY and WEEKLY charts agree with one another in both direction and action. In other words, the DAILY chart provides an actionable box break trading setup in the same direction as the WEEKLY box break and/or trend.
Let’s first look at two recent examples of stocks with great trading setups, one bearish and one bullish, then proceed to potential opportunities.
BEARISH
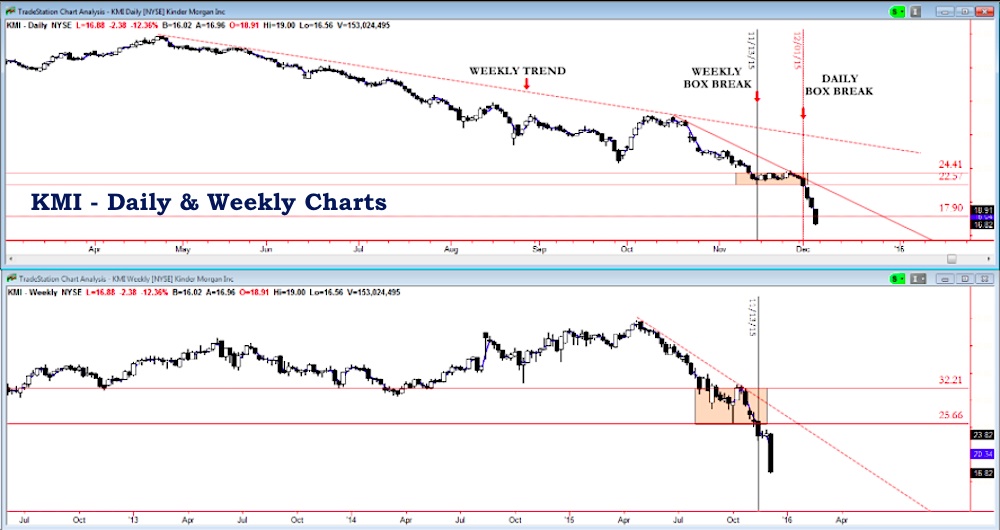
Kinder Morgan (KMI)
KMI has been in a down trend since May of this year. After Kinder Morgan (KMI) bounced in October the trend continued with a new WEEKLY box break the week ending 11/13. We then waited two weeks for the DAILY chart to provide an actionable trade entry below the weekly box break and along its bearish trend. KMI did so on 12/1 providing option traders such as myself a sizable gain with a trailing stop now at 18.
I refer to trading setups such as this as a DUAL CHART CONFIRMATION trade.
BULLISH
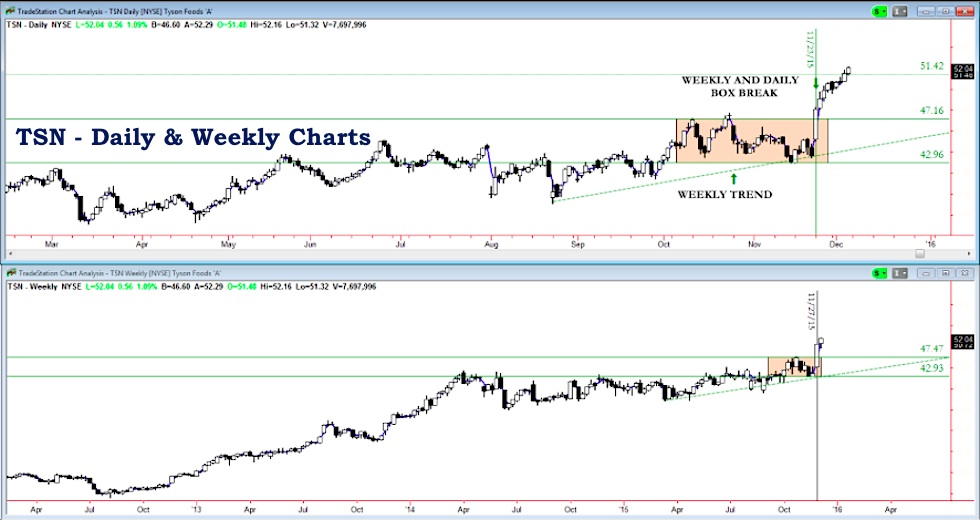
Tyson Foods (TSN)
TSN was trendless from April 2014 until April 2015 then higher lows began developing. The week ending 11/27 saw a box break on both the DAILY and the WEEKLY chart at the same time, providing an actionable trade entry on 11/23. The options continue to increase in value as the trailing stop is now at 51.42. Trading setups like this are referred to as a DUAL CHART BOX BREAK trade.
Now, let’s take a look at a few current and/or potential opportunities based on the same trading setups as above.
BEARISH
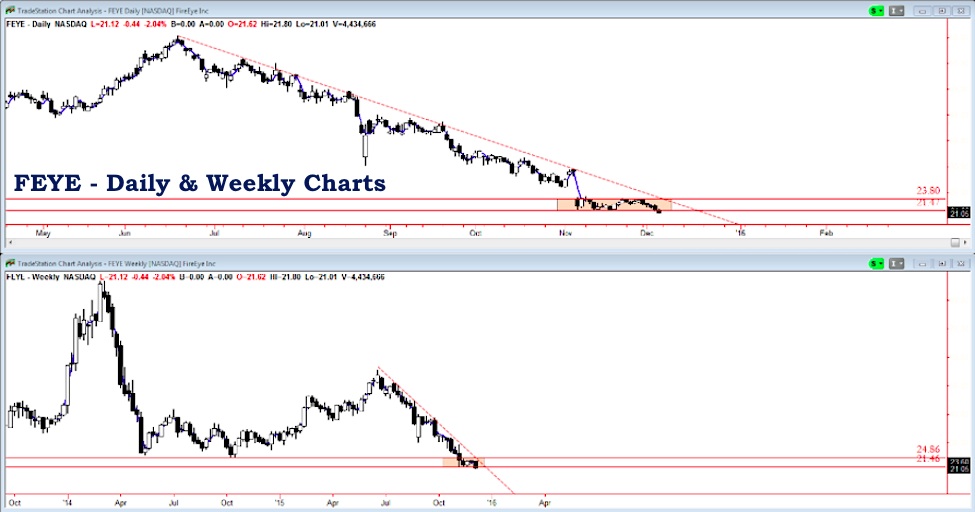
FireEye (FEYE)
FEYE has been in a down trend since the summer and is now breaking both its WEEKLY and DAILY boxes as it prints new all time lows. FireEye (FEYE) is currently a trade for us or a trader can wait on a breakdown test or another pullback along its trend.
continue reading on the next page…


: Showing Some Signs of Emerging Strength")
