What an incredible run since the Euro financial crisis peaked in the summer of 2012, marking the first Pluto-Uranus square on the astrological calendar!
And flash forward: November 1, 2013 will be the fourth Pluto-Uranus square. With the markets pushing to new highs, this sets up as an important juncture in time and price.
The first three Pluto-Uranus squares – June 24, 2012, September 19, 2012, and May 21, 2013 – all proved pivotal points in time for the financial markets. This past March, I penned an introduction to time and price analysis using major planetary aspects and stations. The study highlighted the April 10-12 Pluto station and the third Pluto-Uranus square, May 21. Both dates proved pivotal, especially May 21.
And now, with the S&P 500 (SPX) fast approaching 1800 and time approaching the next Pluto-Uranus square, it seems prudent to take a closer look at potential cautionary signs that may disrupt the upward advance.
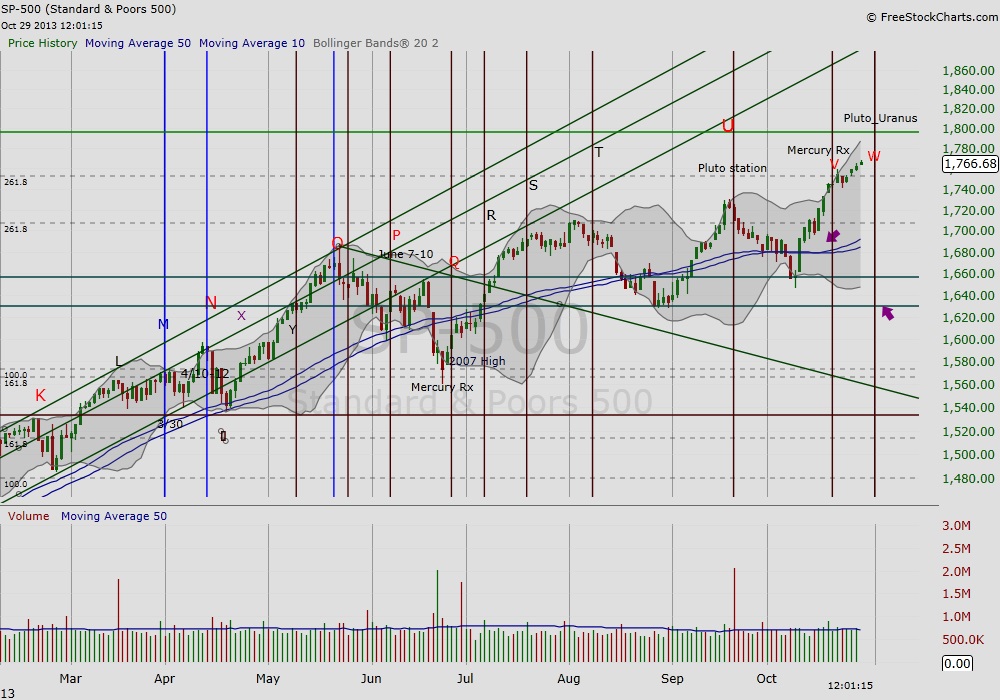
Figure 1, SPX approaches the next Pluto-Uranus square.
Is the market throwing caution to the winds? Teammate Andrew Kassen earlier this month addressed capital allocation to risky small caps in past cycles and what it can tell us about today’s appetite for risk.
Intermarket Divergence. Since our August article studying the relationship of oil and equities, light crude oil futures have come under pressure and are currently trading below the 10/50 day moving average. Demand weakness in oil often precedes weakness in the equities market.
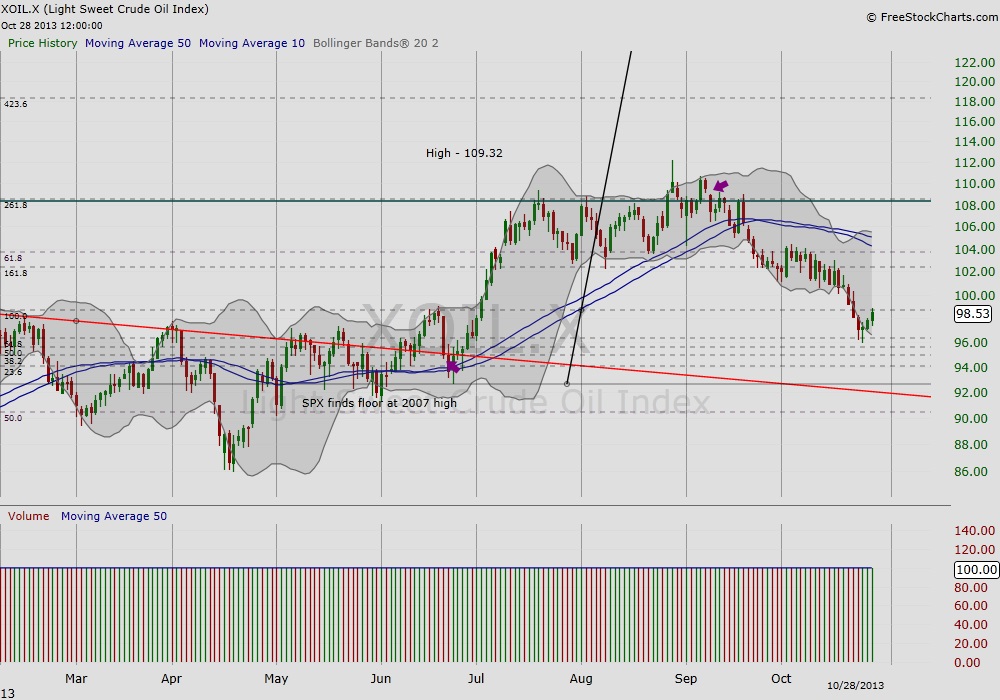
Figure 2, light crude oil falls below its 10/50 day ma while equities remain bullish
Fight to safety? The 20+ year Treasury (TLT) recently recouped its 10/50 day ma. A look at previous turning points for the TLT lines up with equity weakness. This intersection occurs when capital begins to flow out of riskier equities to the safety of long-term bonds.
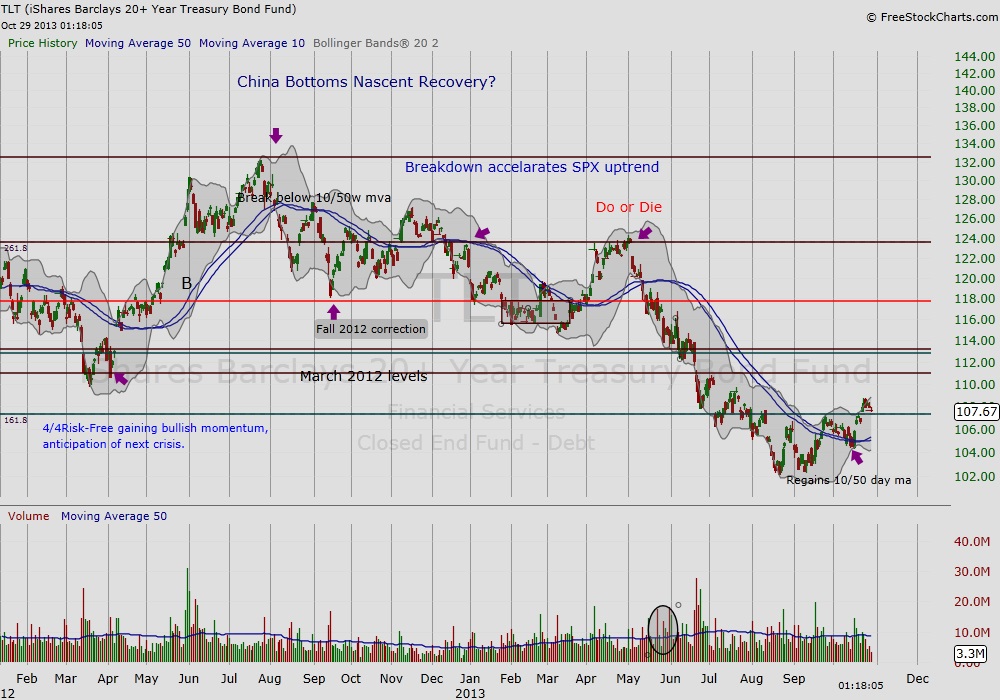
Figure 3, TLT recovers its 10/50 day ma and signals potential move from risk to safety
It has been an incredible year and half since the Euro-crisis hit its peak in the summer of 2012. The subsequent fall correction developed into a major sector rotation with fresh breakouts in cyclicals and financials. However, almost a year and a half since that fateful summer (and the first Pluto-Uranus square), today there is hardly a bear in sight. The current run in Small Caps highlights the market’s risk appetite despite divergent behavior from oil and the bond market (although even the Small Caps are starting to pause a bit). These are just a few things to keep in mind when studying the market’s overall behavior in the coming week… as investors approach an important point in time and price.
Thank you for reading.
Twitter: @RinehartMaria
Charts courtesy of FreeStockCharts.com
No position in any of the mentioned securities at the time of publication. Any opinions expressed herein are solely those of the author, and do not in any way represent the views or opinions of any other person or entity.


