For the past two weeks, we have been discussing a divergence in Volatility. Specifically, the observation is that the move lower for the stock market in 2016 has not been met with an explosion in volatility.
For reference, here are the links to those posts:
Volatility has been much faster to collapse than rally despite the sharp decline in stocks. For reference, the S&P 500 Index is down 6.7%, while the Russell 2000 Index is down 10% this year (and that include huge rallies to end last week!). Notice the VIX:VXV volatility ratio’s sharp decline.
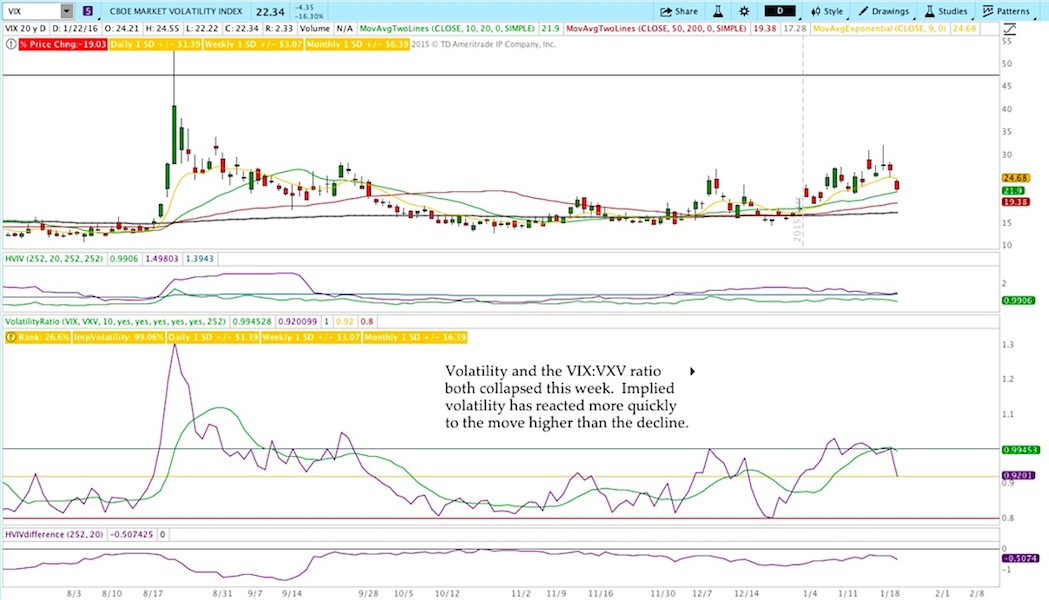
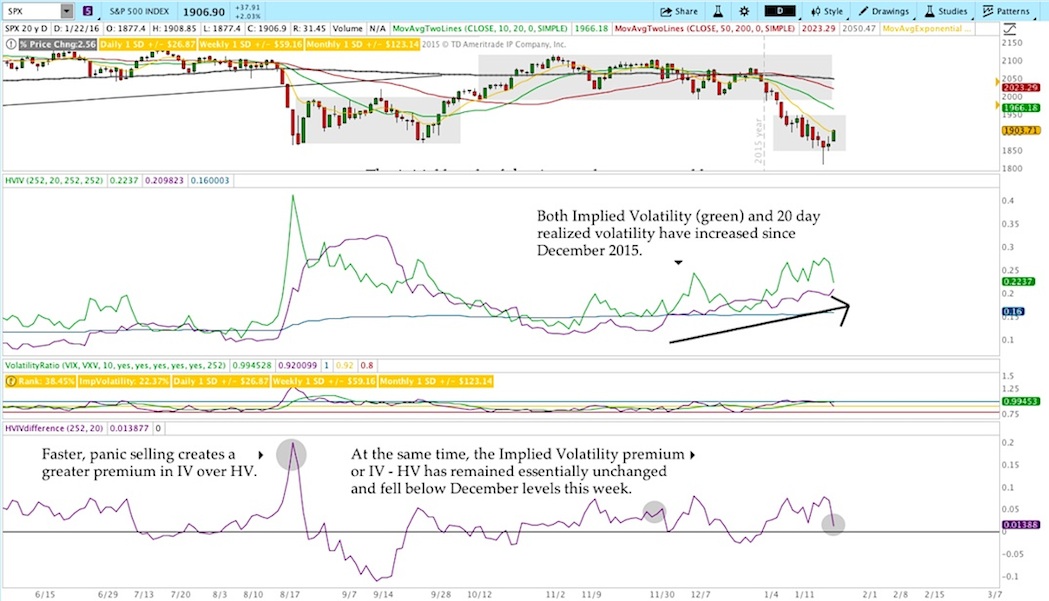
The premium of Implied Volatility (IV) over Historical Volatility (HV) is quite low right now given the recent decline and that validates the notion that the move lower in stocks is under control (at least for now). Additionally, the VIX:VXV ratio has fallen back to a more normal level even though the major stock market indices are clearly damaged from a price standpoint.
So the question now is whether or not this divergence in volatility will come back to haunt stocks at some point.
The reality is that we don’t know what will happen from here, but panic and capitulation selling of stocks have not entered the market yet. That realization suggests we’re likely to see either stability with a move sideways to higher or an unexpected breakdown followed by the panic that typically accompanies declines.
When you consider both price action and volatility, it seems likely that we’ll see some stability come into the market over the coming weeks. That being said, heavy unexpected selling could flip the market very quickly with the amount of complacency we see. So it’s probably a good idea to keep this divergence in volatility in the back of your mind.
The market needs more participants to be caught off guard in order for panic to ensue.
Market Stats
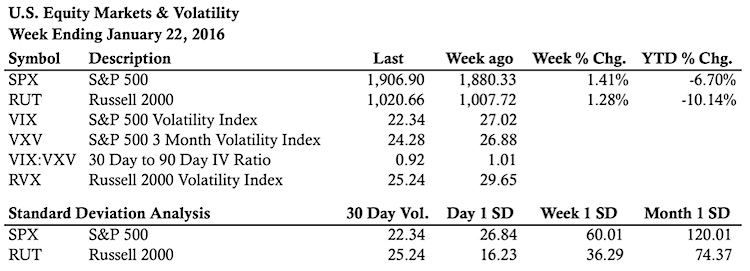
Stock Market Levels of Interest:
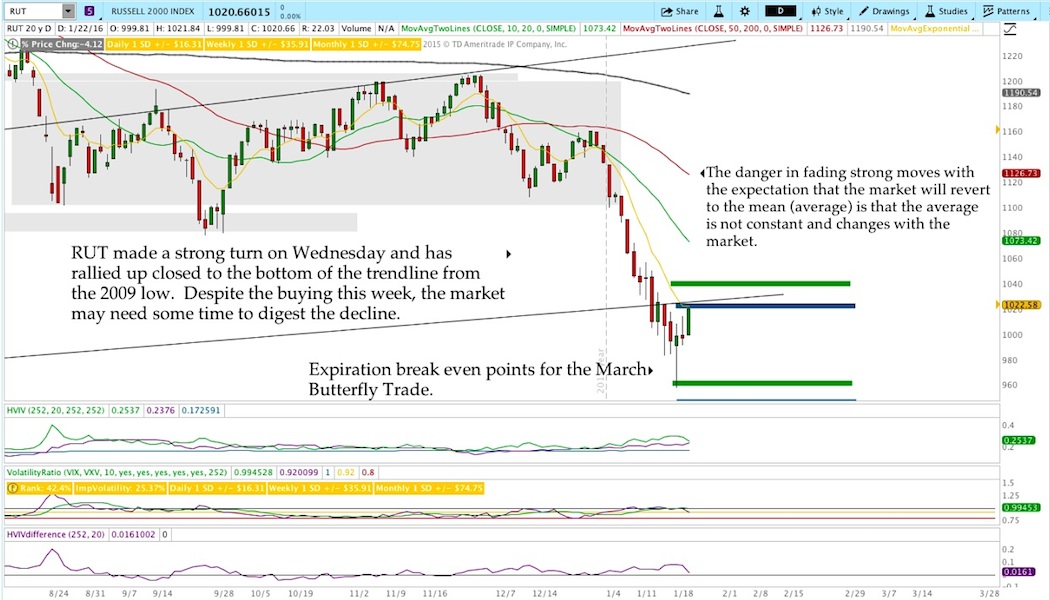
A quick look at the daily charts for the Russell 2000 Index (RUT) and S&P 500 Index (SPX) to see what’s happening in the market.
Russell 2000 Index – Daily Chart
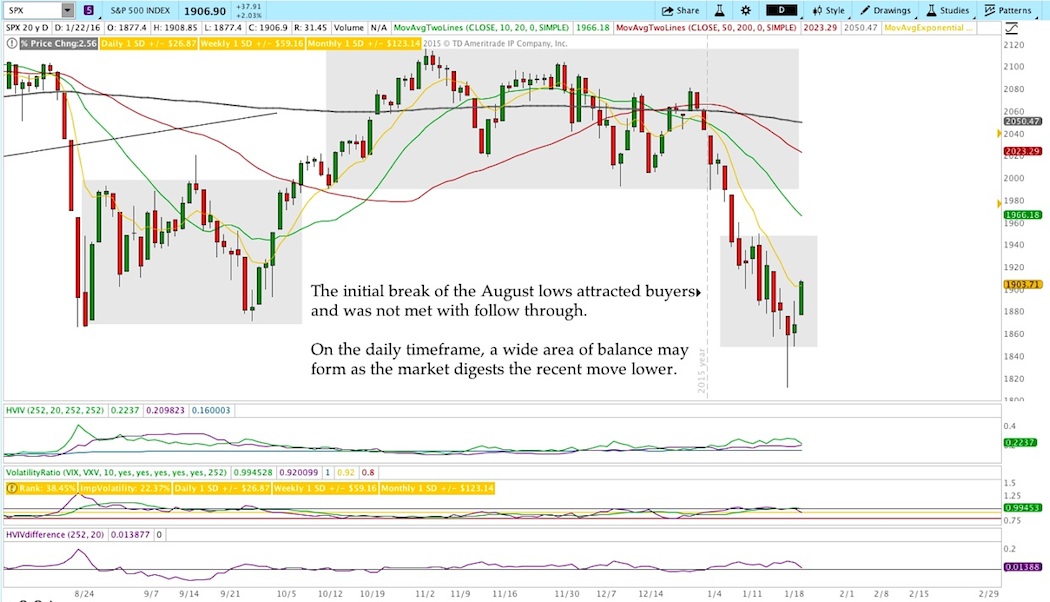
S&P 500 Index – Daily Chart
Thanks for reading.
Twitter: @ThetaTrend
Author holds positions in S&P 500 and Russell 2000 related securities at the time of publication. Any opinions expressed herein are solely those of the author, and do not in any way represent the views or opinions of any other person or entity.


