As the stock market takes a breather, it’s worth noting that an important market indicator is at a critical juncture. With the S&P 500 (INDEXSP:.INX) pulling back a few percent off the highs, a critical stocks-bonds ratio is testing trend line support.
And if that support breaks, it could mean a full blown correction for stocks.
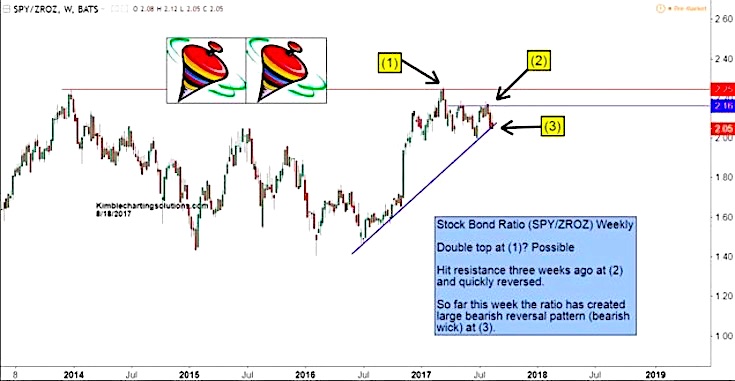
The ratio that I’m using in the chart below is comprised of the S&P 500 ETF (NYSEARCA:SPY) and the Zero Coupon Bond ETF (NYSEARCA:ZROZ). Since the 2014 highs, the ratio has moved in a wide range, chopping back and forth. However, since early 2016, it has been headed higher. But a few concerns have developed of late:
Point (1): Potential double top with 2014 highs
Point (2): Lower high
Point (3): Now testing uptrend support line
If the ratio fails to hold its trend line support, it could suggest further weakness in stocks (relative to bonds). And this type of action would hint at a deeper pullback. Stay tuned!
And thanks for reading.
Twitter: @KimbleCharting
Any opinions expressed herein are solely those of the author, and do not in any way represent the views or opinions of any other person or entity.


 Ready To Break Out?")
