One of the more interesting relationships to watch is the price relationship of stocks to bonds.
Investors can watch this performance battle using a ratio of the S&P 500 (SPY) to the 20 Year Treasury Bond ETF (TLT).
If this SPY/TLT ratio is heading higher, stocks are preferred to bonds. And if it’s heading lower, bonds are preferred to stocks.
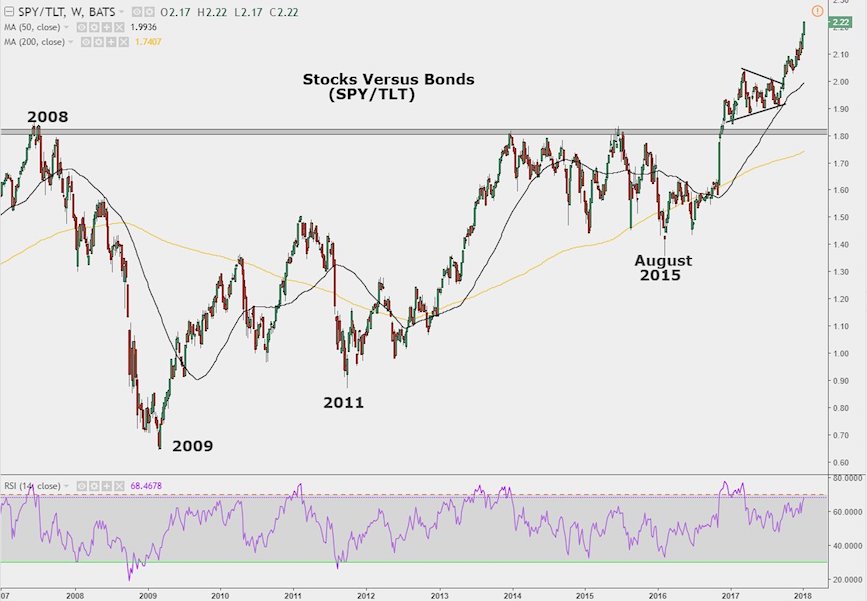
The ratio tells us a great deal regarding risk taking versus safety. The chart below highlights how the ratio fared during periods of stress such as 2008 to 2009, the European debt crisis in 2011, and Chinese Yuan devaluation in 2015.
After a long period of consolidation, the ratio is making new highs and well above the 2007-2008 peak. This doesn’t mean the market is cheap or that the market will go higher. However, it does signal that investment participants have been very willing to take on risk and still are willing to take on risk today.
Keep an eye on this ratio as it may be helpful in identifying the next turn.
S&P 500 (SPY)/20 Year Treasury Bond ETF (TLT) Ratio Chart
ALSO READ: Chart Spotlight: Volatility Sinks To Start 2018
Twitter: @_SeanDavid
Any opinions expressed herein are solely those of the author, and do not in any way represent the views or opinions of any other person or entity.

: Showing Some Signs of Emerging Strength")

