The Year of Our Lord 2014 opened with US equities pushing yet further into the still-rarefied but increasingly pedestrian ether of new all-time highs.
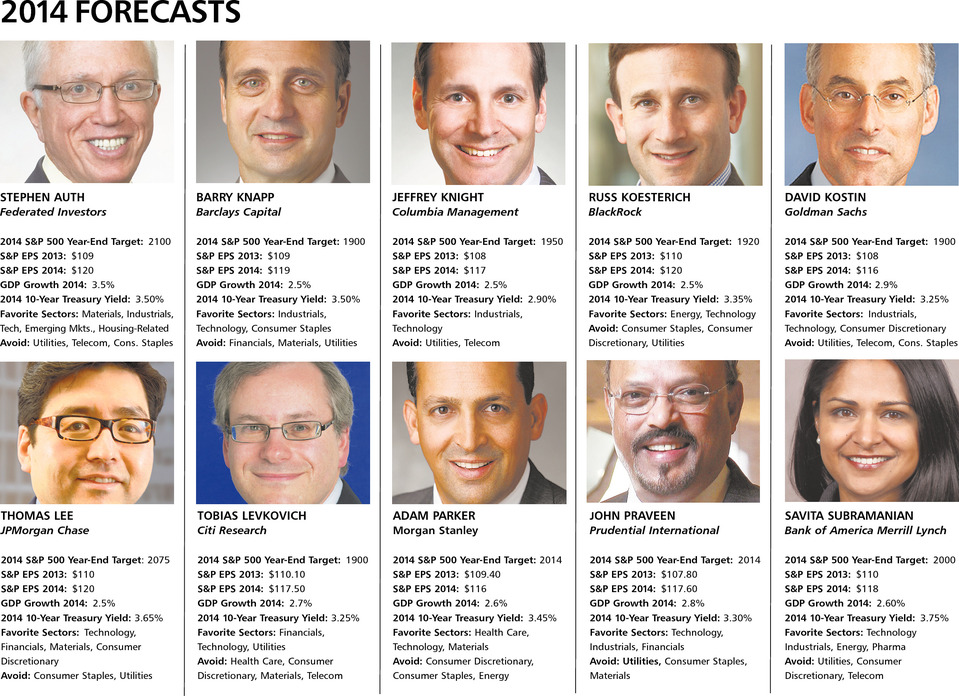
Not unlike 2000, the best and brightest augurs strategists on the Street see 2014 as a continuation of the outlier year just previous:
The latter half of January offered some disagreement on this point. Stocks began to break down; and then rather than the “customary 2013” bounce started to deteriorate further. VIX spiked over 20 and didn’t immediately crater. The 10-year began to rally, even as the FOMC confirmed (December) and re-affirmed (January) tapering (though it’s SOMA portfolio will continue to see huge net increases as it rolls maturing assets over), etc. The technical evidence of a correction was still wanting, though, and by the middle of last week there were some tentative signs the pullback would remain just that. 4 sessions and +4% later, the S&P 500 (SPX) is putting forward little disagreement with the notion the mini-panic of January 2014 is nearly over.
With that out of the way, it’s open sky above to SPX 2000. Right?
Today’s session represents significant progress toward that end: up 18 points (1%) to 1818, the S&P sliced above the ubiquitously-monitored 50-Day Simple Moving Average (50SMA) at 1809.50 during newly-appointed Fed Chairman Janet Yellen’s inaugural Sadie Hawkins Hudson Hawk Humphrey Hawkins testimony before Congress.
In a carefully choreographed dove-hawk strophe-antistrophe, Yellen pushed rate tightening out into a shadowy, perhaps even structurally unattainable future by all-but nullifying the 6.5% threshold with bafflingly vague rhetoric while concretely affirming the FOMC’s current taper trajectory. It seems tightening and tapering are two different things – at least when they’re carefully played off against one another as the Fed seeks to manage “the expectations channel”.
Initial indications are: it worked – at least for risk appetite: Along with the 50-Day SMA, SPX also crossed above the 61.8% retracement of January’s pullback, retaking over 2/3 of the ground lost since 01/15/14’s 1850.84 high.
And now with this 6th consecutive up-day nearly in the bag, January-February 2014 really is beginning to look a lot like 2013 again. Though not as compressed, May-August 2013 feature a remarkably similar scenario: a harmonic Bearish Shark pattern that took SPX to new nominal all-time highs near 1705 in 14-of-15 up days (above early May’s swing into the 1680s) before rolling over to 1625 in August (such unthinkable, quaint levels, these).
The path is already set for a bearish shark this time around: all that’s left is for a hard rally to 1855-1860 (“new nominal all-time highs”, yet again).
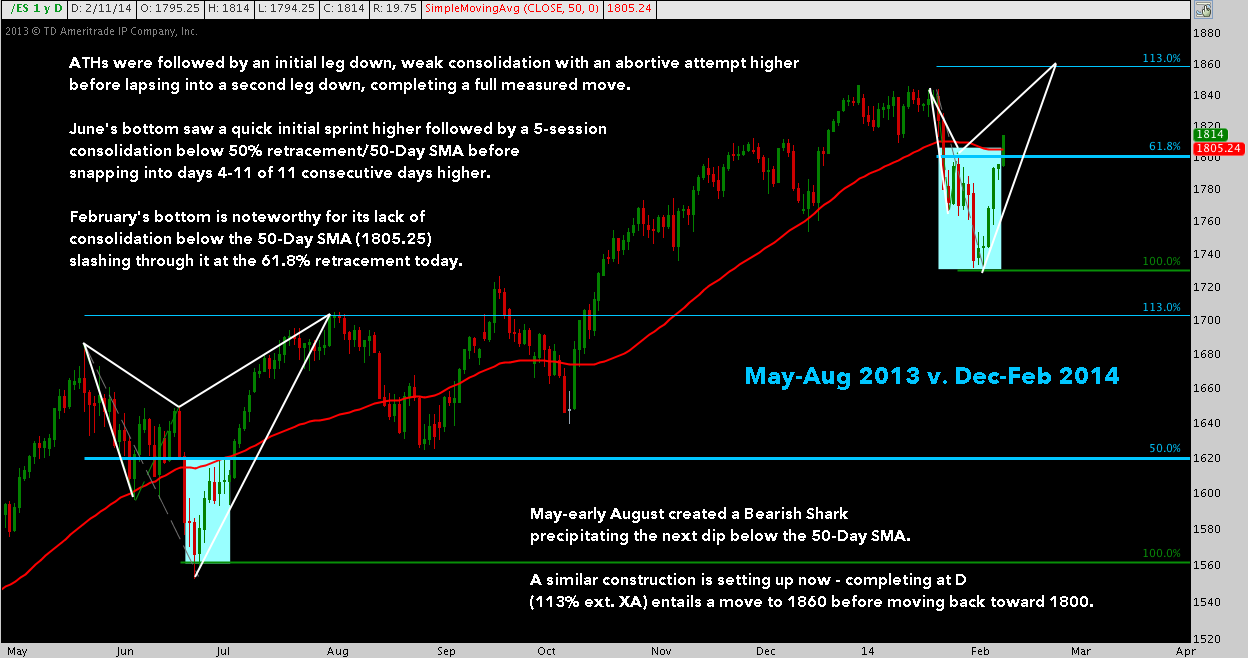
From there, 1790-1800 becomes an initial target.
That doesn’t sound at all like SPX 2000. Instead, it sets up a last-gasp, all-in +8% run that turns out to be an insidious bull trap. From there, the outstanding bearish patterns mentioned here are confronted yet again. Between here and 1860 we’ll find out if those multi-year harmonic setups prompted January’s pullback consolidation only; or if we’re slowly unwinding a topping process that results in an SPX that substantially lower before the year is through.
Twitter: @andrewunknown and @seeitmarket
Author holds no exposure to securities mentioned at the time of publication.
“Is This It” image from The Strokes’ “Is This It” album art, copyright RCA Records
Any opinions expressed herein are solely those of the author, and do not in any way represent the views or opinions of any other person or entity.


 and Semiconductors (SMH): Concerning Price Pattern?")


