Friday brought with it the first day the S&P 500 suffered a decline of -2% or more in over 7 months. That’s not a record (not even close), but it does feel like a very, very long time (and after 2008-2011, it probably should).
Was last week (historically a dismal passage in the trading year anyway) the start of a benign, 2013-style pullback; or is 2014 about to brand complacent bulls with a searing realization of just how much of an outlier 2013 was?
Some variation of that question has been asked about and conjectured over all weekend. As it stands, my read is that the facts of momentum, breadth and sentiment are (dis-satisfyingly) mixed with the forces of “this time is different” and “more of the same” evenly matched. That in itself is different than most of 2013; but a lack of similarity isn’t enough to lay affirmative bets on a deep correction. Not yet.
The S&P 500 broken down conveys the same picture. Below you’ll find the S&P’s nine major sectors broken out, updating November’s review of the multi-year harmonic patterns that have been unfolding almost all of them. The message is the same in each case (except perhaps with Utilities, symbol: XLU): the index’s Q4 2013 performance drove most sectors into and in several cases above major cyclical resistance in unsustainable trend/channel trajectories.
January’s mostly sideways movement and last week’s rout has begun the work of leveling off these trends with most of them pulling back from, or (in the case of the leaders) returning to test these major resistance levels from above. It would be disingenuous if I didn’t mention: these patterns (best evoked by SPY’s own composite pattern, found at the end) are big; and they are bearish. They’ve been setting up for many months (in some cases, years) and the implication if they behave according to form is a steep correction; perhaps even a bear market.
No reason to panic, though. The facts on the ground develop one day at a time; and phrases like “correction” and “bear market” are idle prognosticating at the moment. Whether these levels now hold will determine if this is just one more pullback, or the beginning of something greater.
Sector: Healthcare (XLV)
Performance (all performance rolling and quoted through 1600ET, 01/24/2014)
- Week: -2.49%
- Month: 0.98% (Best Monthly Sector Performance)
- Quarter: 6.12%
- YTD: 0.4% (Best YTD Sector Performance)
Healthcare took over the mantle of relative strength leader from Consumer Discretionary (XLY) in early January as the narrative of an anemic Christmas shopping season gathered force on disappointing retail data. With last week’s hit, XLV’s monthly candlestick regressed from an aggressive move skyward into an indecisive (and potentially bearish) Shooting Star.
The good news for trend continuation:: Healthcare remains above every local form of resistance converging near 54-55. This represents a kind of consolidation from which the ETF could spring higher.
The bad news: the shooting star brings XLV back to effectively unchanged since the November close. This brings the sector back to its bearish Deep Crab potential reversal zone (PRZ) around 55 at point D with a bearish tone that wasn’t present during the first visit in Q4 2013.
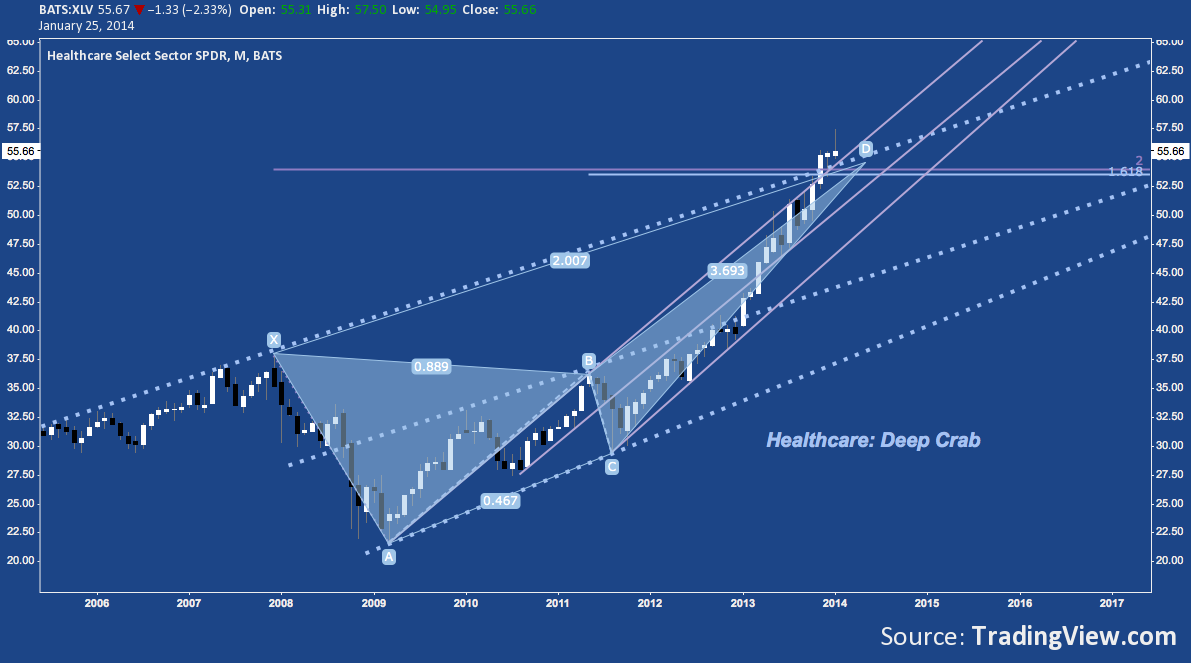
As we’ll see below, other sectors exhibit a similar “overthrow” pattern where bullish momentum pushed price beyond major resistance, breaking above already aggressive upward trend trajectories. XLV and XLY are most representative of the finite viability of an “overheated” market: neither has had the character of a blow off; but by accelerating through steep and then steeper trend angles, their redlining momentum may have finally induced real bullish exhaustion.
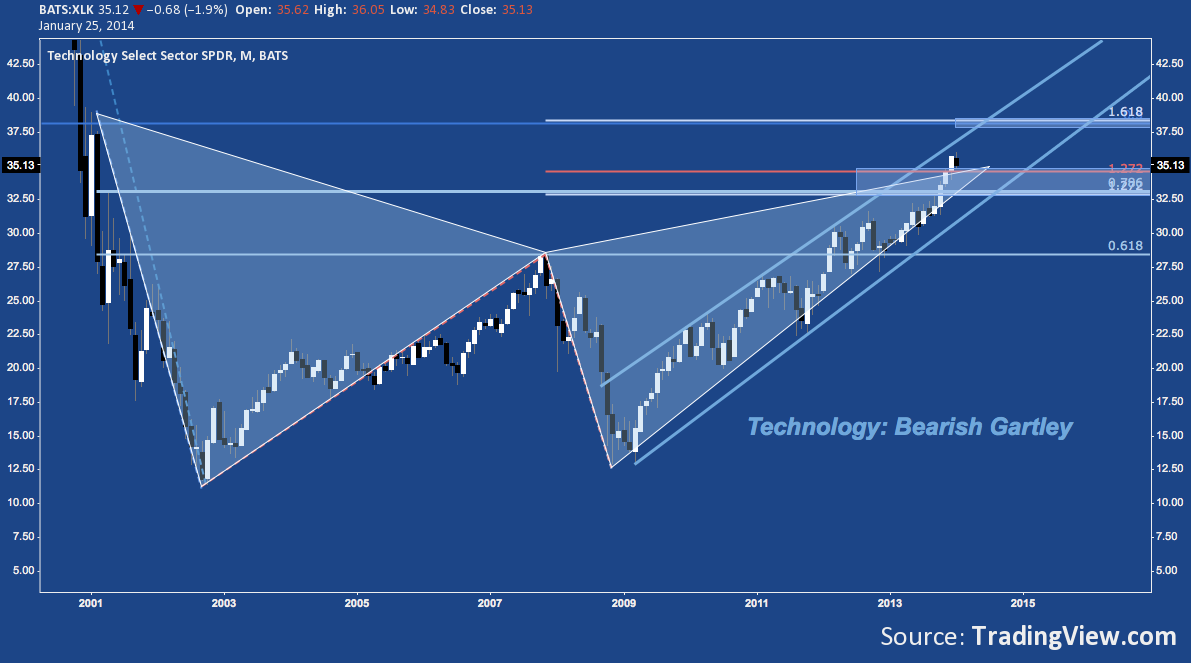
Sector: Technology (XLK)
Performance:
- Week: -2.28%
- Month: -0.82%
- Quarter: 6.17% (best Quarterly sector performance)
- YTD: -1.71%
Tech has a different 5-point Harmonic pattern: a Bearish Gartley working off early 2001’s major throwback. XLK is very comfortably inside its rising channel off the 2009 bottom. Like Healthcare (XLV), it overthrew it’s pattern’s PRZ and is now revisiting it. Will that 33-35 area (including rising channel support near 33) now function as support? If so, cluster resistance at 38 is next. But if not, a channel break opens up a decline to Gartley point B near 28 – a 20% drop from Friday’s close.
Sector: Consumer Discretionary (XLY)
Performance:
- Week: -2.88%
- Month: -3.71% (worst Monthly sector performance)
- Quarter: 2.47%
- YTD: -4.98%
Healthcare and Tech are joined by Consumer Discretionary as a cyclical bull market leader; but as mentioned earlier XLY has taken a major hit in January. Just like XLV and XLK, Discretionary’s monthly chart exhibits a break above major resistance (at 63-64) – still inside the rising channel that began in November 2012, but overthrowing the larger and already-elevated rising channel in effect off the October 2011 bottom.
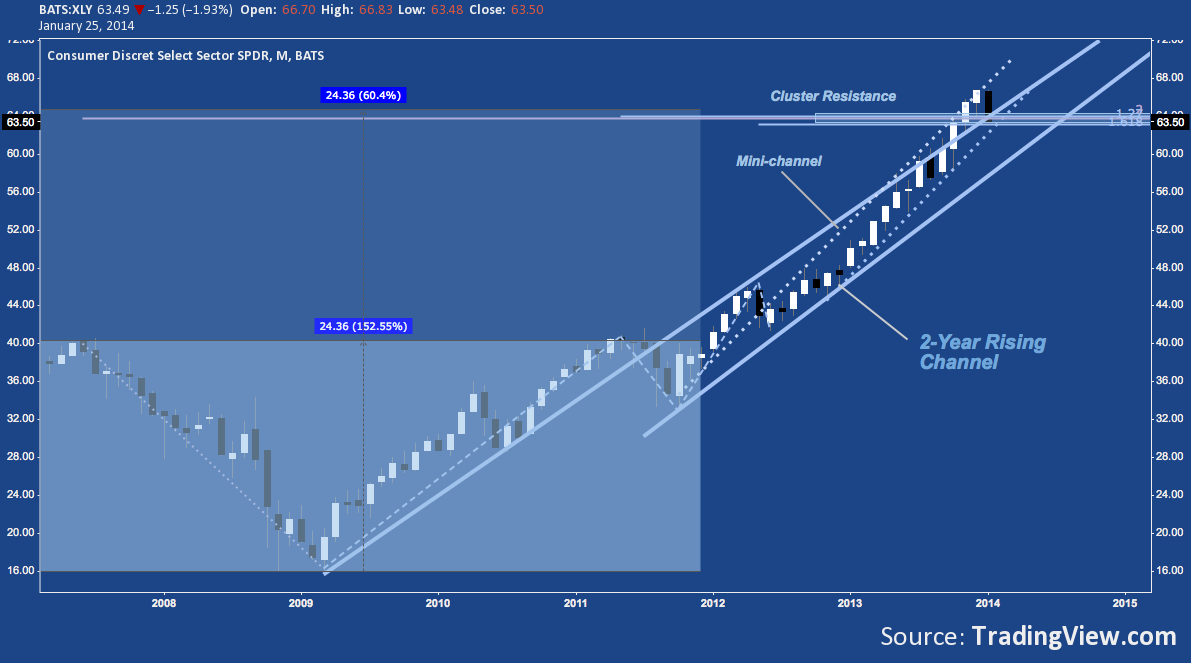
XLV, XLK, XLY: all relative strength leaders following the same script: will the major resistance they blew through and subsequently returned to hold? If XLY fails here, the larger rising channel offers support at 60 next. A modest foothold comes in beneath there at 56; and then open air until 46-48.
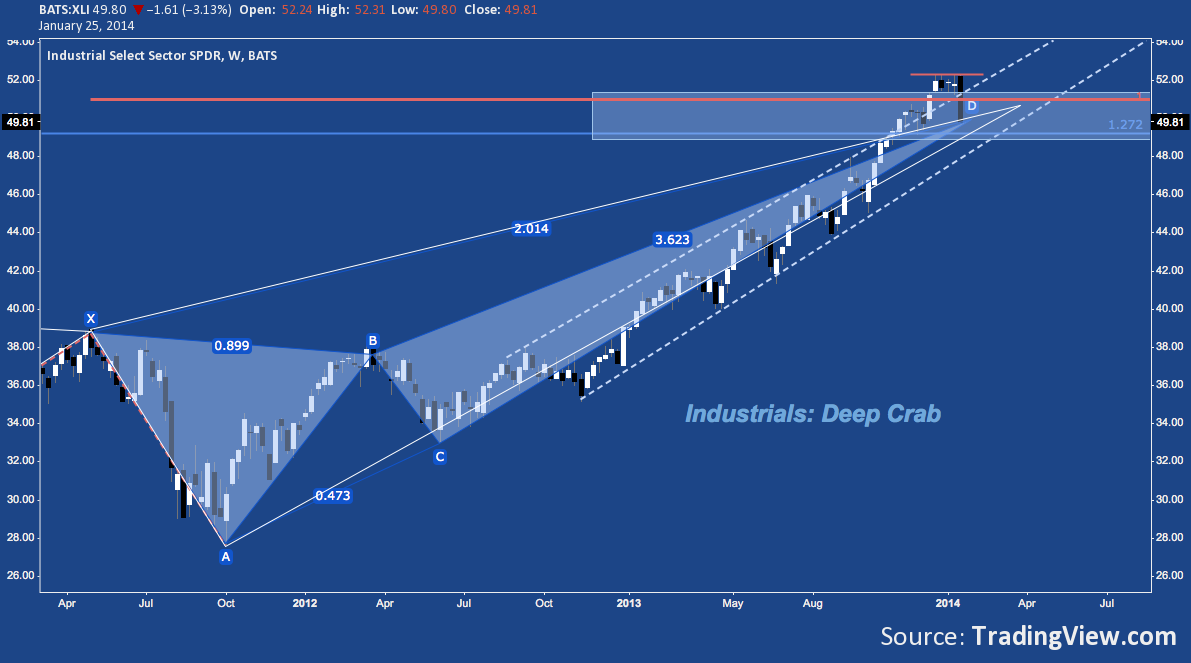
Sector: Industrials (XLI)
Performance:
- Week: -4.36%
- Month: -3.21%
- Quarter: 3.97%
- YTD: -4.69%
Industrials have posted a bearish Deep Crab off early 2011’s high at X. Another overthrow is in play: above 2013’s rising channel and the potential resistance zone (PRZ) between 49-51.50. Last week brought a return to the rising channel and deep back into the PRZ. Support comes in at channel and PRZ support at 49, with stair-step support rungs underneath all the way to B near 38 at 48, 46, 44, 42 and 40.
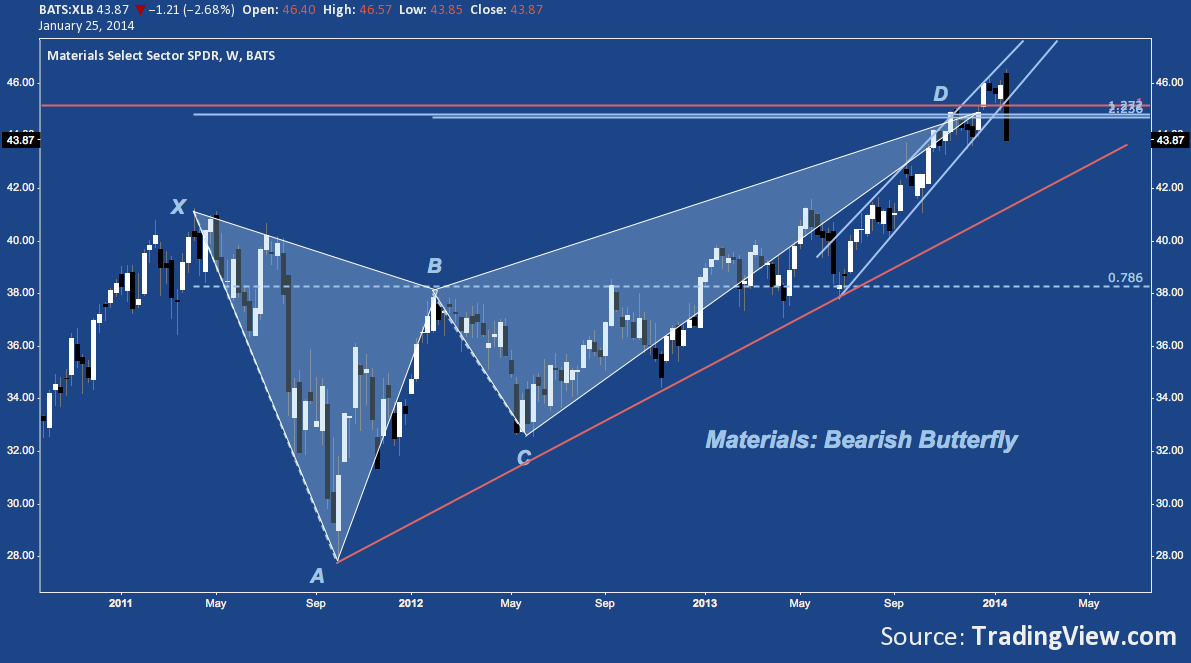
Sector: Materials (XLB)
Performance:
- Week: -4.71% (worst Weekly sector performance)
- Month: -2.84%
- Quarter: 0.57%
- YTD: -5.08% (worst YTD sector performance)
Advancing throughout a tight rising channel since mid-Summer, Materials also overthrew it’s bearish Butterfly Potential Reversal Zone (PRZ) at D before breaking below the channel and back through the PRZ last week. Support is already near at-hand forXLB at 43-43.50 and then rising trend line support off the Fall 2011 low at 41-42.
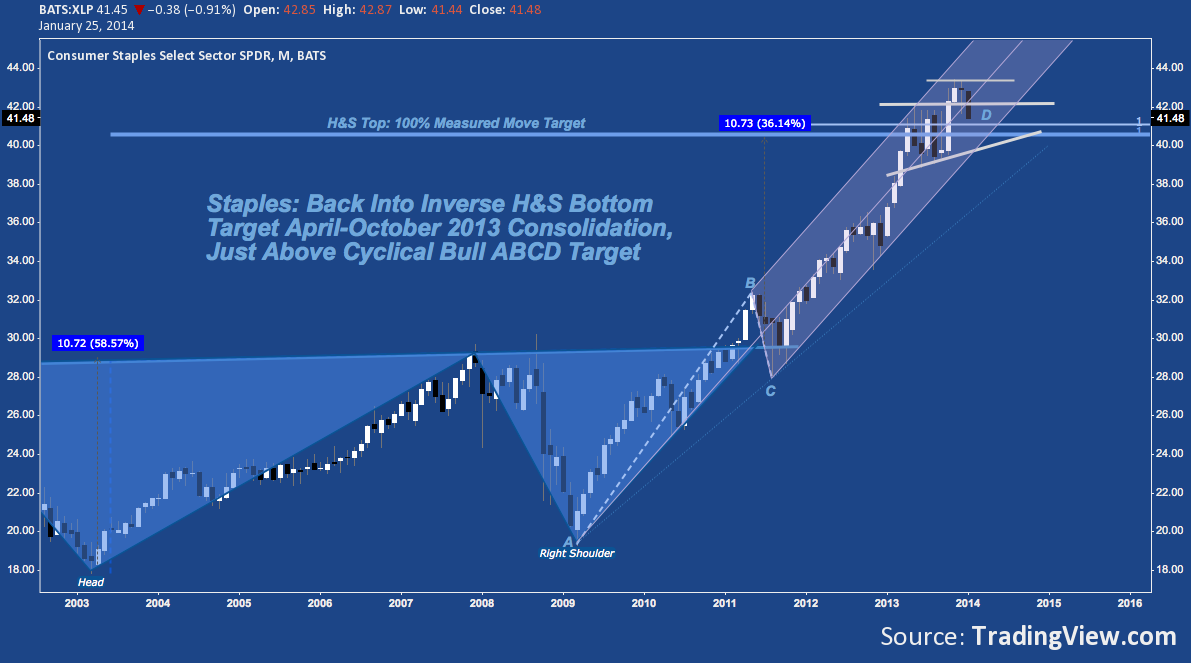
Sector: Consumer Staples (XLP)
Performance:
- Week: -2.17%
- Month: -2.42%
- Quarter: -0.48%
- YTD: -3.49%
The S&P’s traditionally defensive sectors usually march to beat of a different drummer; and right now is no exception. Consumer Staples spent the last half of 2013 in broad consolidation after tagging a long-term Inverse Head & Shoulders pattern measured move target at 40-41. Along with its pro-cyclical peers, XLP moved higher in Q4, breaking higher in November in an apparent overthrow of its own. Staples stalled in December, and is now back into 2013’s consolidation zone.
Will the measured move resistance XLP built toward since 2009 now act as support? There’s a solid opportunity of this through 39; but a break leaves the sector wide open down to 35.
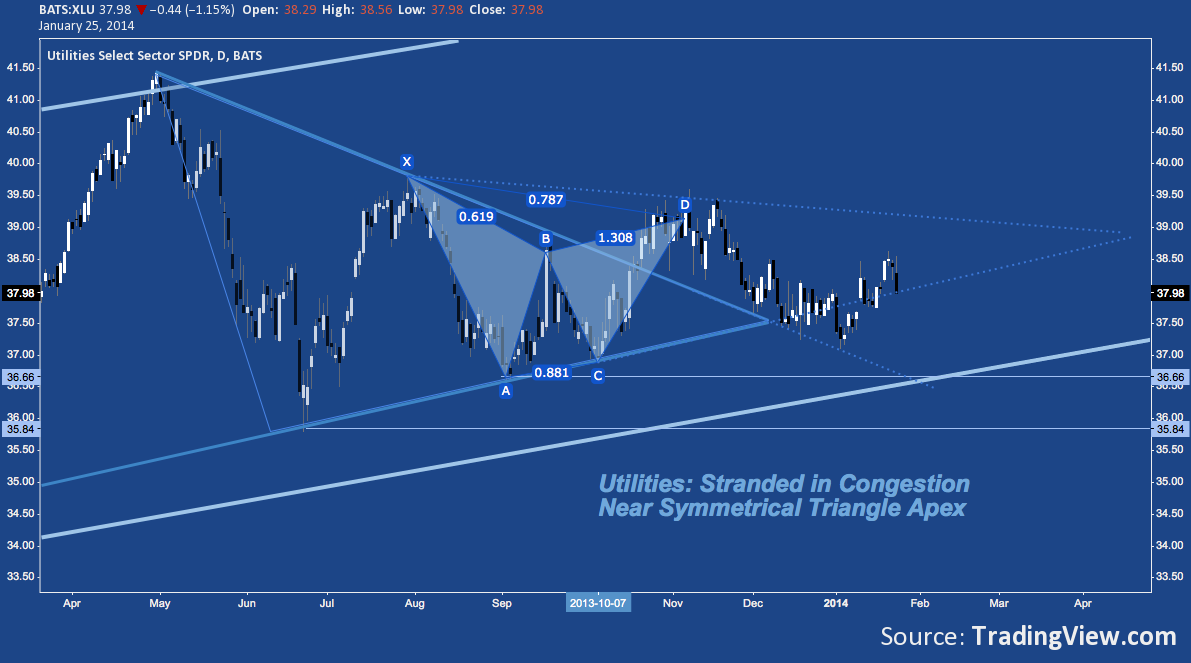
Sector: Utilities (XLU)
Performance:
- Week: -0.24% (best Weekly sector performance)
- Month: 0.8%
- Quarter: -1.25% (worst Quarterly sector performance)
- YTD: 0.03% (best YTD sector performance)
More than Consumer Staples, Utilities really is in a world all its own. Wholly unloved in Q4 2013, XLU sold off from a smaller Bearish Gartley PRZ then as the rest of the market moved higher. True to its reputation, however, the defensive sector has seen inflows over January; and though it wasn’t immune to Friday’s sell off, like Staples it outperformed admirably by shedding only -1.15% that day (compare XLI’s -3.13%). Never one for excitement, XLU is effectively unchanged since June 2013.
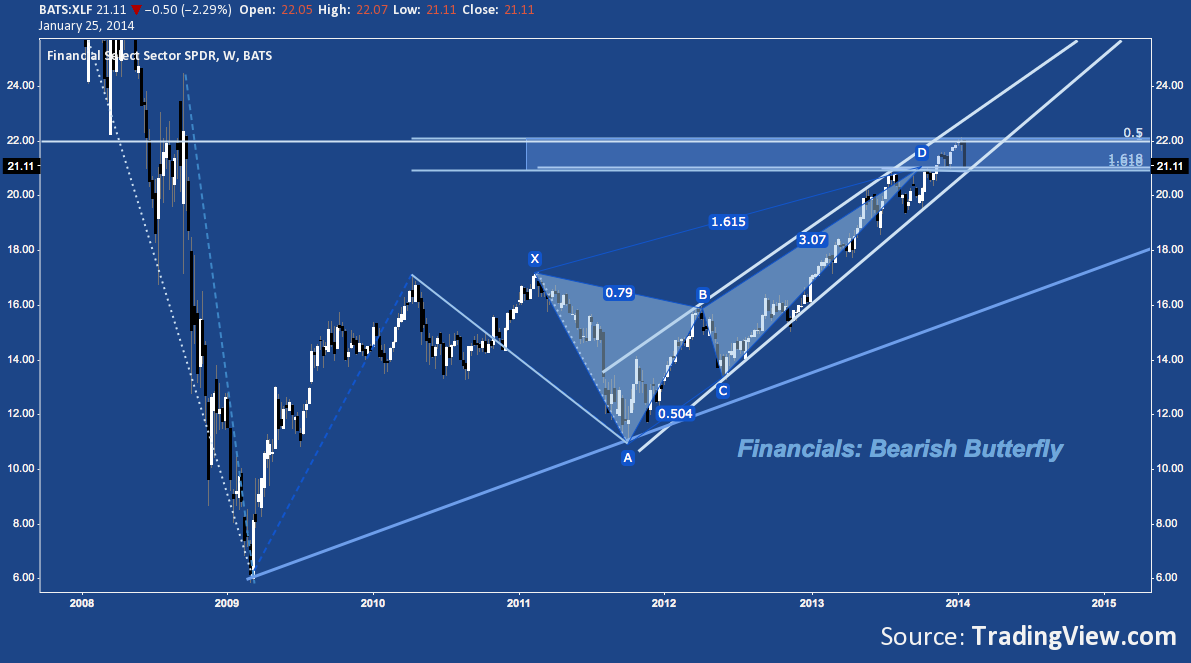
Sector: Financials (XLF)
Performance:
- Week: -4.05%
- Month: -2.76%
- Quarter: 2.28%
- YTD: -3.43%
In keeping with the harmonic theme, Financials has also been working through a bearish Butterfly, though it’s covered more ground by advancing to the 161.8% extension of line XA (whereas XLB, for example, only reached 127.2%). XLF pushed up through it’s PRZ in December and January, only to see last week’s rejection at its upper boundary near 22.
Now Financials are testing the fibonacci confluence making up the lower boundary and rising channel support at 21. Just below, the congestion of 2013’s second half (and Q3 2008) near 20 acts as support, followed by X at 17.50-18 and B near 16, with major rising trend line support off the 2009 low coming in between these.
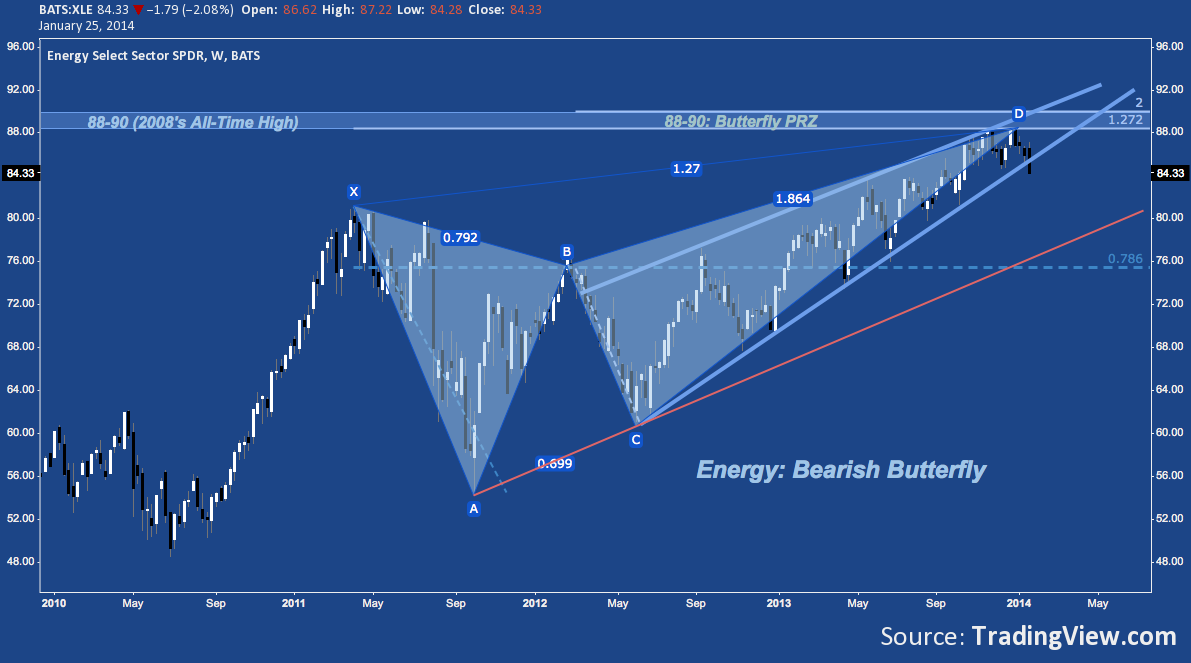
Sector: Energy (XLE)
Performance:
- Week: -2.11%
- Month: -2.8%
- Quarter: -1.1%
- YTD: –4.72%
Like several of its peers, Energy has been working through a bearish Butterfly since Summer 2011. But as a relative strength laggard, XLE did not break higher than its PRZ, which coincides with it’s 2008 all-time high near 90. After moving sideways through December and January, XLE broke down last week, below December’s low and below rising wedge support.
May-October 2013’s resistance near 83-83.50 act as first support, with 2011’s high at X near 81 coming in next. Rising trend line support off the Fall 2011 comes in near this level.
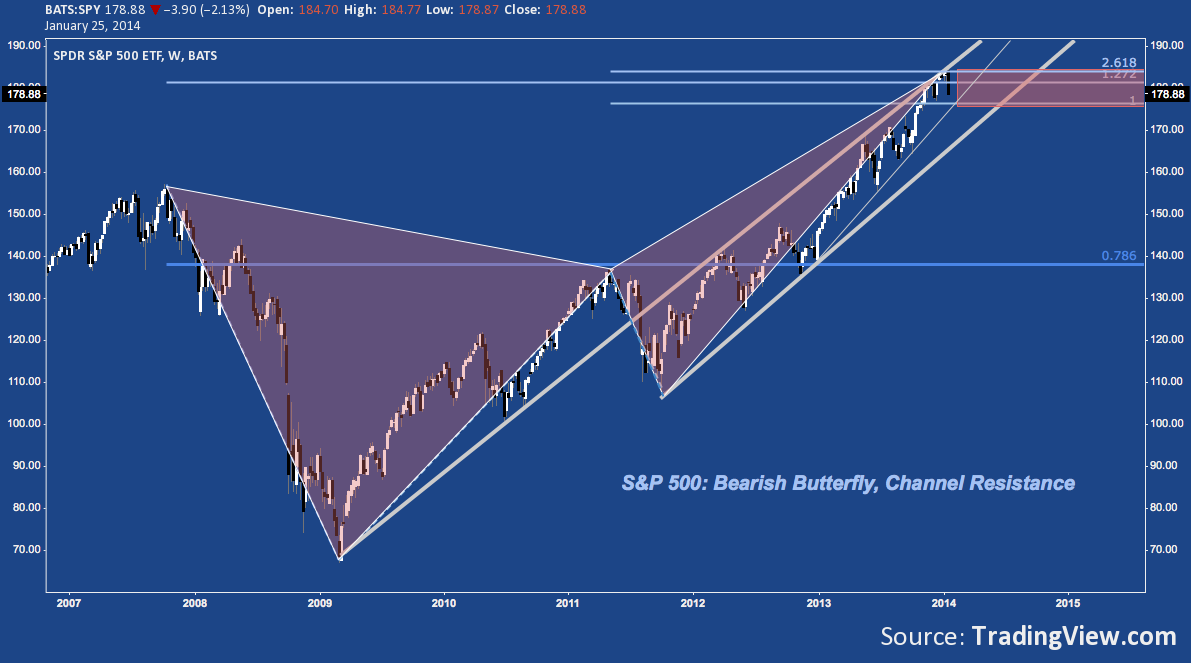
S&P 500 (SPY)
Performance:
- Week: -3%
- Month: -1.99%
- Quarter: 3.03%
- YTD: -3.14%
Not surprisingly, as a composite, SPY is 1) bouncing off of rising channel resistance originating from the Fall 2011 low (and through trend line resistance off the 2009 bottom); and 2) in the middle of the PRZ of its bearish Butterfly (originating from the 2007 high). A substantial but garden-variety pullback (something we haven’t seen since late 2012) sees SPY moving to a) the bottom of its rising channel and b) former resistance-turned-potential support from June-October 2013 around 168-170. After 2013 this target area seems far distant; but in real terms it’s a benign move, only rivaling October-November 2012’s decline and at its worst still doesn’t qualify as a legitimate correction of -10% or greater.
Twitter: @andrewunknown and @seeitmarket
Author holds no exposure to instruments mentioned at the time of publication. Commentary provided is for educational purposes only and in no way constitutes trading or investment advice.
Any opinions expressed herein are solely those of the author, and do not in any way represent the views or opinions of any other person or entity.


: Showing Some Signs of Emerging Strength")
