The price action this week stirred up a lot of discussion around, “is the market is topping?” conversations.
Let’s review current price levels and market themes:
S&P 500 (NYSEARC: SPY) 281 is pivotal. Hard to tell yet if this is working a double top or building muscle to make new highs. 283 if clears better
Russell 2000 (NYSEARCA: IWM) 166 was our line in the sand-if takes it back relief. If not, Gramps could be heading to 162.25 next. Unconfirmed phase change to warning.
Dow (NYSEARCA: DIA) 252.00 support. Resistance at 255.75.
Nasdaq (NASDAQ: QQQ) 180 pivotal resistance now. Support at 174.75
After the Russell 2000, or the Gramps of Made in America, posted 3 lower highs since June 20th, the rallies did appear shallower and shallower.
So, not a real big surprise that after the 4.1% GDP announcement, the overheated economy gave rise to a market sell off, led by IWM.
The Russell 2000 fell by 2.02%.
Now, Gramps did have some help.
FANG stocks, the overcrowded and bordering-on-the-ridiculous in terms of the bullish sentiment lately, helped.
The NASDAQ 100 fell by 1.41%.
Yet, Transportation (IYT) hung tough.
In fact, IYT had an inside day on Friday-traded within the range of the day prior-and maintained its bullish phase.
So there’s that.
Nevertheless, many investors have their head in a vice, with the promise of the American stock market domination etched in their brains.
Maybe it’s the blood moon.
Whatever, the question now on nearly everyone’s mind is, “Was this the top?’
We feel so comforted by the economic Modern Family, and especially the weekly charts.
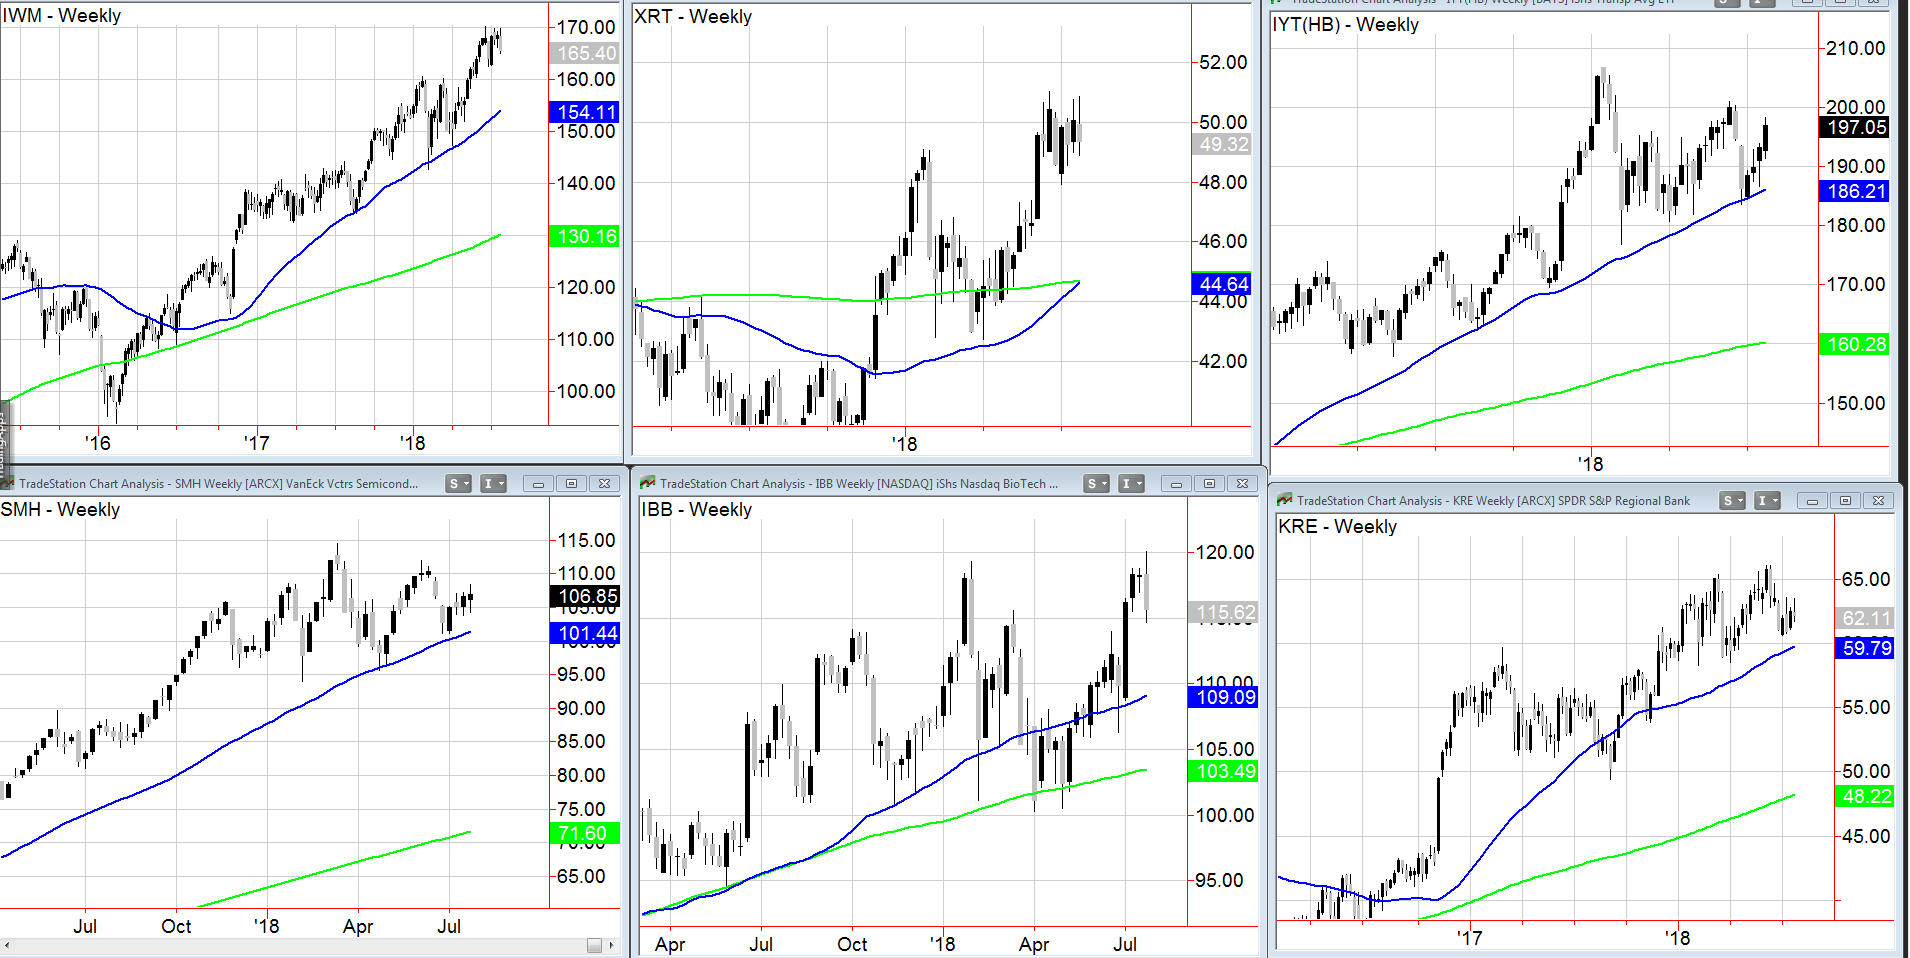
From left to right, top row, the chart on IWM is clear.
With 170 the Promised Land, IWM has plenty of support below at the 50-week moving average. Until that picture changes, bias still positive.
Granny Retail (XRT) is a hair away from a Golden Cross on the weekly chart. That makes the underlying support at 44 solid until it’s not. However, XRT has had multiple attempts to crack 50.00. That’s the point bulls need to look for to stick.
Transportation (IYT) can make it all happen should it clear over 200. But first, it must hold around 194.00
Bottom row left to right-Sister Semiconductors (SMH).
Like IWM, this has made lower highs since its apex in March. We will give this a chance to clear 109 for health.
If not, under 106 could spell a trip to 101.50-the 50-week MA.
Next, Biotechnology (IBB). Typically, the last ones in tend to hold the flimsy bag. 115 is interim support. And only a move over 120 will save this in a big way.
Finally, Prodigal Son Regional Banks, (KRE). Maybe the most vulnerable as any further sell off might prompt a drop in interest rates. Plus, the daily chart looks toppy. A move under 61, and the 50-week MA at 59.80 becomes key support.
Of course, the dollar is another key. As I am on alert for a slowing economy-more likely-and rising commodities-also likely-how UUP does will map the way.
Twitter: @marketminute
The authors may have a position in the mentioned securities at the time of publication. Any opinions expressed herein are solely those of the author, and do not in any way represent the views or opinions of any other person or entity.


