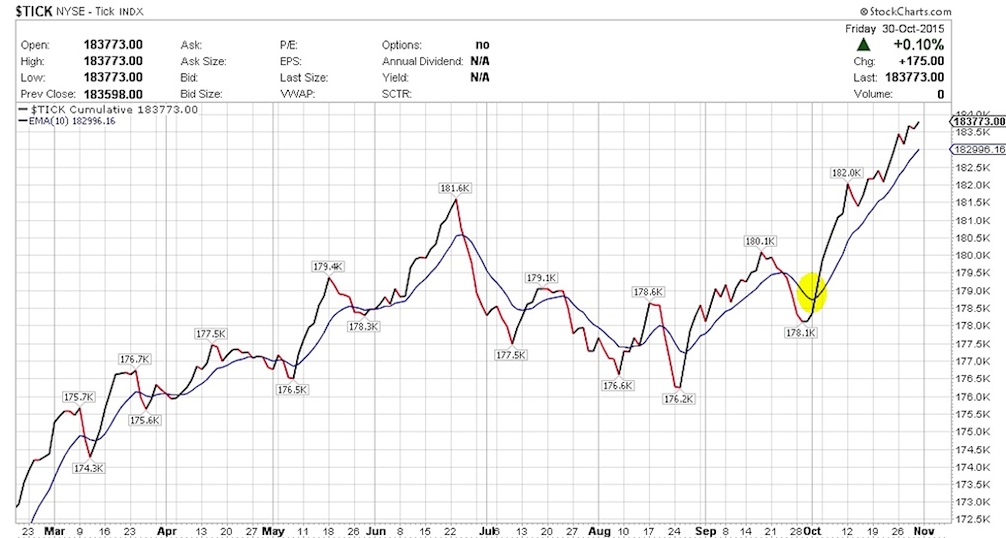
$TRIN & $TICK:
Barring some negative ticks during the week, not a whole lot of negative here on $TICK. It is slightly extended from the 10 EMA and pausing to catch up 10 EMA might not be a bad idea.
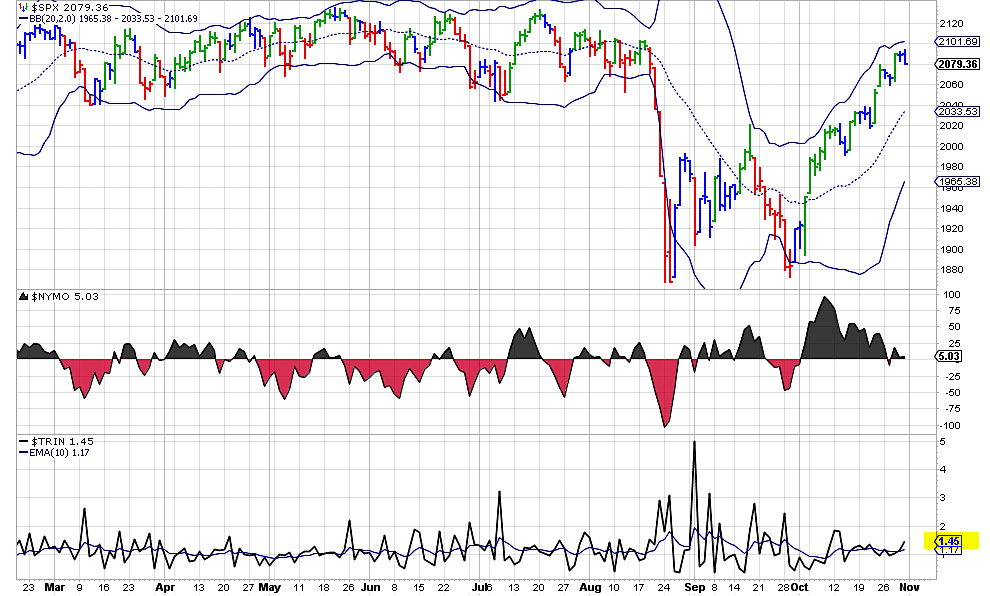
$TRIN has been a great gauge of late. On Friday it was over 1.00 towards 1.58 or so but settled at 1.45. If we were to pause in the indices and go much lower, then I would like to see this over 2.00 or 3.00. Until then trade the range. Of course as always, I will be monitoring both $TICK and $TRIN very closely.
TICK Indicator Chart
TRIN Indicator Chart
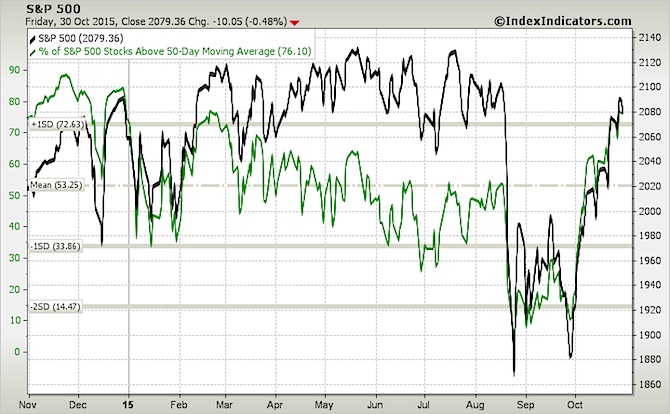
% of S&P Stocks Above 50-Day Moving Average – 76.10. Was 74.30 last week
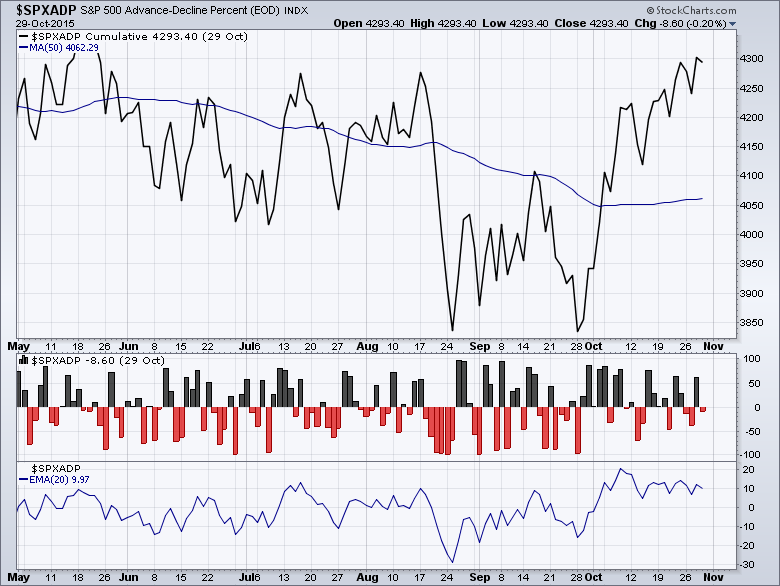
$SPXADX – Advance-Decline Data:
The Triple view of the Advance Decline data for $SPX. After some consolidation mid week, the Advance Decline Line started to move higher. With the 50 moving average beginning to rise, this looks bullish overall. However, the Advance Decline line seems to be resting again. This needs to be monitored but so far no signs other than a pause.
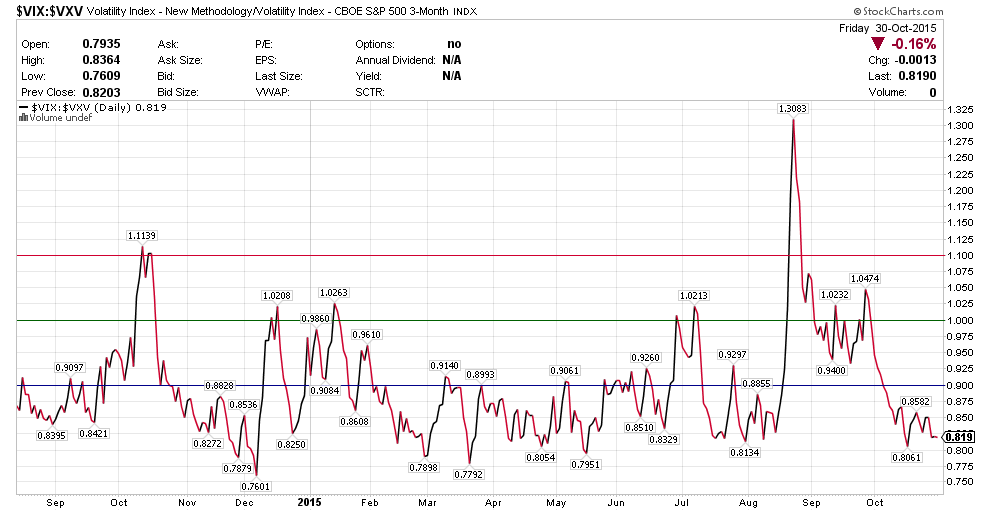
$VIX:$VXV:
$VXV is the 3 month volatility index. The relationship between $VXV and $VIX (30 day volatility) or the ratio between them if > 1.00 often spells trouble for equities. This ratio is back lower and ended at 0.819. Expecting this to remain subdued with mini pops along the way.
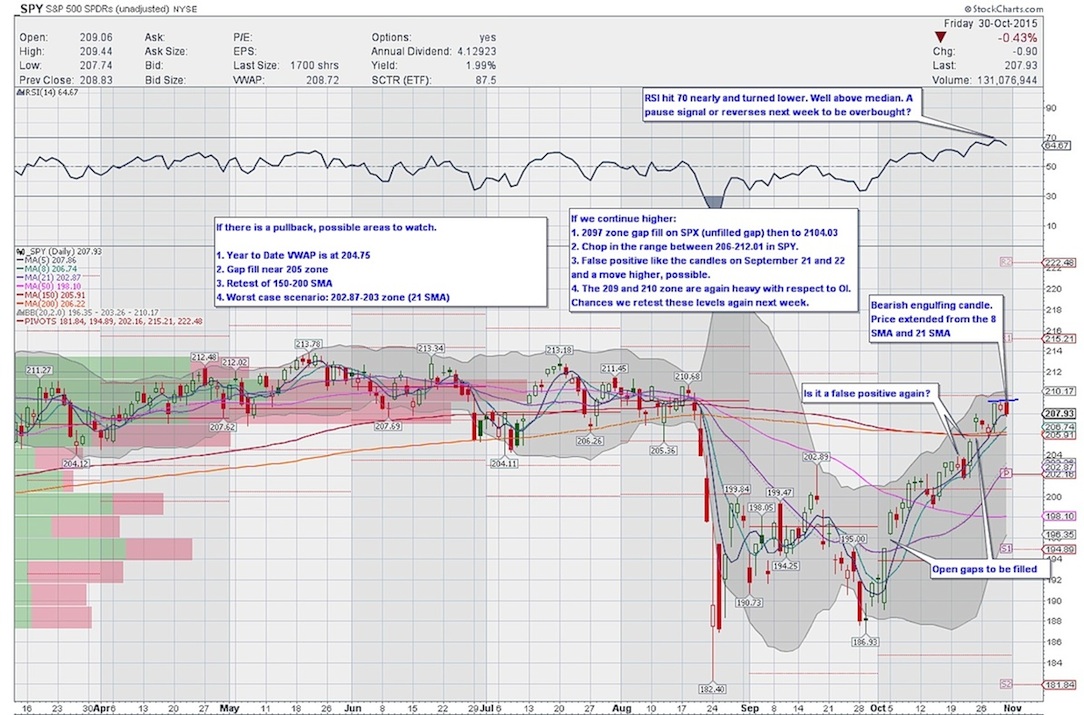
$SPY DAILY TIMEFRAME:
On the Daily timeframe, the S&P 500 ETF (SPY) started to move higher over the 200 day moving average and held it right through the week. The move lower on Tuesday got many excited as it started going lower but all it did was a retest of 200 day moving average and held it well before proceeding higher after the FOMC and GDP numbers on Wednesday and Thursday. There were several intraday gyrations late last week before a strong move higher mid-day Friday… only to give all of that back and more in the last hour. But this week is off to a promising start.
Friday was an outside day for the S&P 500 ETF (SPY) and it printed a Bearish Engulfing candle as well. Is that a bear trap like the one on October 21st? It’s possible. Either way, price is extended from the 8 and 21 day moving averages and allowing the moving averages to catch up with price is healthy.
If we see a pullback $SPY could retest one of these levels: the 200 day moving average or a gap fill just below 205 or Year-to-Date VWAP around 204.75 or 23.6% percent retracement at 204.14,
Any pullback would be very healthy, in my opinion. And the levels listed just above may be good places to initiate a long. From a momentum indicators standpoint, RSI is close to 70 and MACD is extended
Thanks for reading and have a great week. You can read more of my weekly analysis on my website. Thanks for reading.
Twitter: @sssvenky
The author has a net long position in S&P 500 related securities. Any opinions expressed herein are solely those of the author, and do not in any way represent the views or opinions of any other person or entity.

 Testing Important Price Support")
: Cup (and Maybe Handle) Watch")

