While I was a bit cautious heading into last week, the week turned out to be more bullish than expected save for the final hour on Friday. It wasn’t that I was looking for a big pullback, just some healthy consolidation.
The ideal scenario would have seen the S&P 500 pause, pull back a bit and then rip higher into the FOMC and GDP.
That didn’t happen and we simply continued higher.
Nothing has changed technically for stocks. The S&P 500 is still above its 50 and 200 moving averages and nearing overbought. Yet I still don’t see a sell signal.
Here are some thoughts:
1. Higher highs and higher lows on the stock market indices
2. The 21 day moving average is rising now, not falling
3. Equity put/call ratio is declining steadily
4. VIX Futures Term Structure is in CONTANGO
5. VIX Volatility Index declining bodes well for stocks, low volume.
6. The actual signal for a reversal is missing. Need either a very high volume reversal candlestick or trade in a narrow range on low volume and then that leads us lower. Not seeing either of them yet.
7. I hardly look at sentiment meters as they are not real gauges to price action. However what I have noticed is that the bullish exuberance has not yet fully returned. I still see a ton of traders with bearish calls. It often bodes well for higher prices and that might just suggest that this run in the rally may not be over just yet.
Market breadth is also noteworthy, but we’ll cover that shortly.
Some short-term stock market indicators are overbought and most sectors are extended. Short Interest % has come down as shown below but that doesn’t state that there are no shorts at all. Overall there are plenty of traders still short and can fuel a bigger rally later this year but perhaps after some consolidation.
And if you have more doubts, notice that several Large Cap names are still being chased and owned. Doubts on that? See stocks like Google (GOOGL), Amazon (AMZN), Microsoft (MSFT) and even Apple (APPL).
This week we have some big Economic Reports due including the ADP Employment Report on Wednesday and the Non-Farm Payrolls on Friday. To add to this, a ton of Federal Reserve representatives are talking including Federal Reserve Chairman Ms. Janet Yellen.
Alright, let’s see what the charts say. We’ll start with stock market breadth indicators first and then finish with the S&P 500 ETF (SPY).
Market Breadth Indicators:
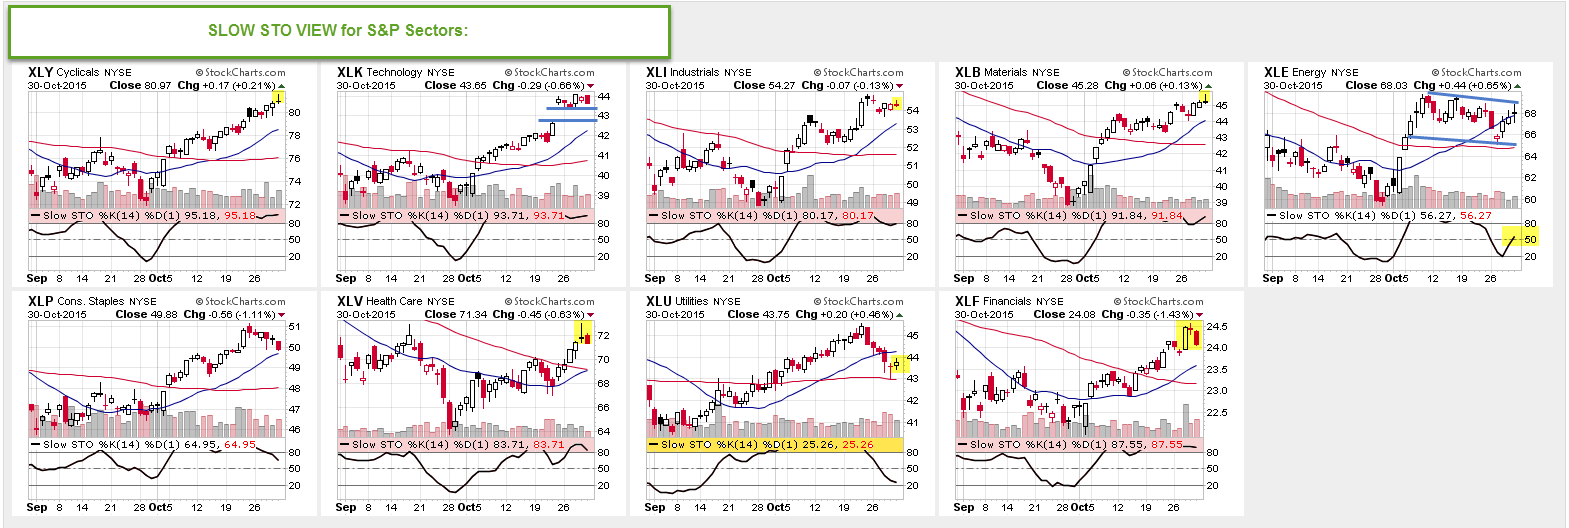
Here’s an S&P 500 sector glance with Slow STO perspective. 7 out of 9 sectors are overbought. The Energy Sector ETF (XLE) looks to be in a bull flag though with Slow STO rising while the Utilities Sector (XLU) is near oversold and a possible reversal there could be on cards.
Note: Slow STO is a bound indicator. (click to enlarge)
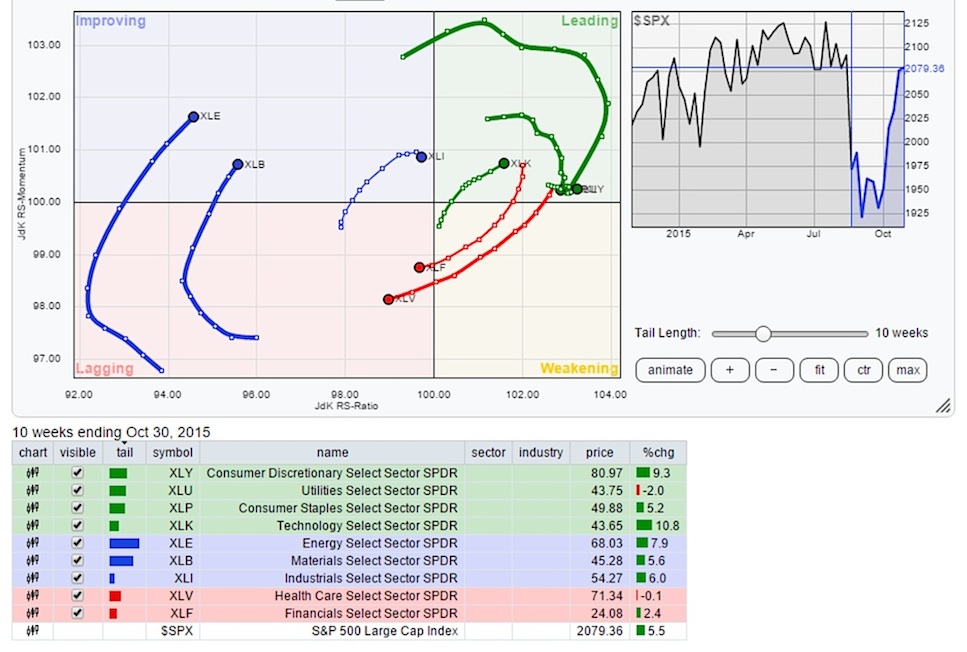
Here is the Relative Rotation Graph (RRG) chart showing the leaders and the laggards among the 9 sectors.
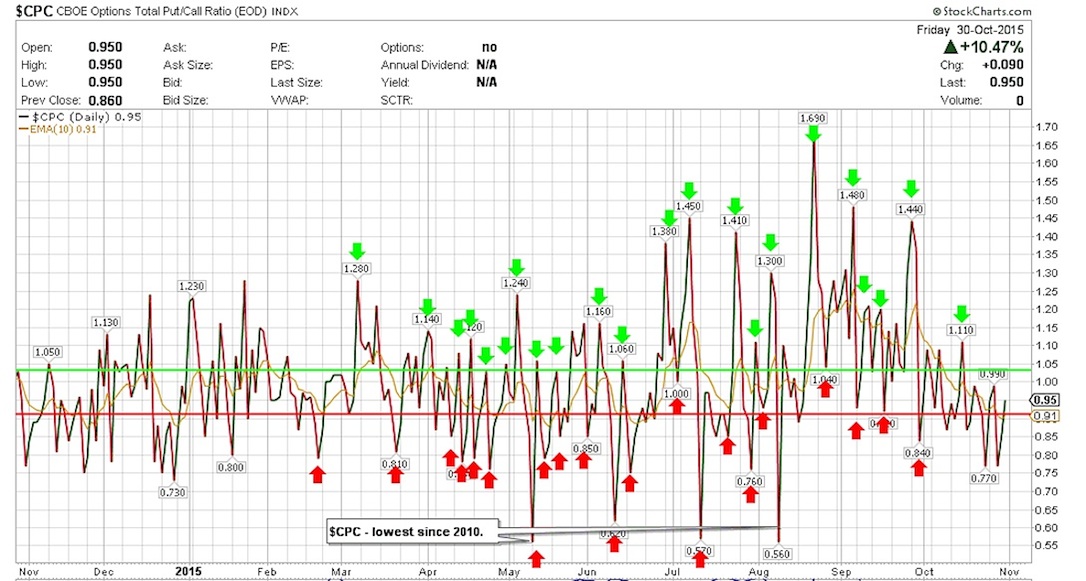
$CPC – Put/Call Ratio:
There has been a steady decline or even chopping in the range between .70 and 1.00. The week ended at 0.95 and the Equity only Put/Call ratios still remain on a buy signal as they continue to decline.
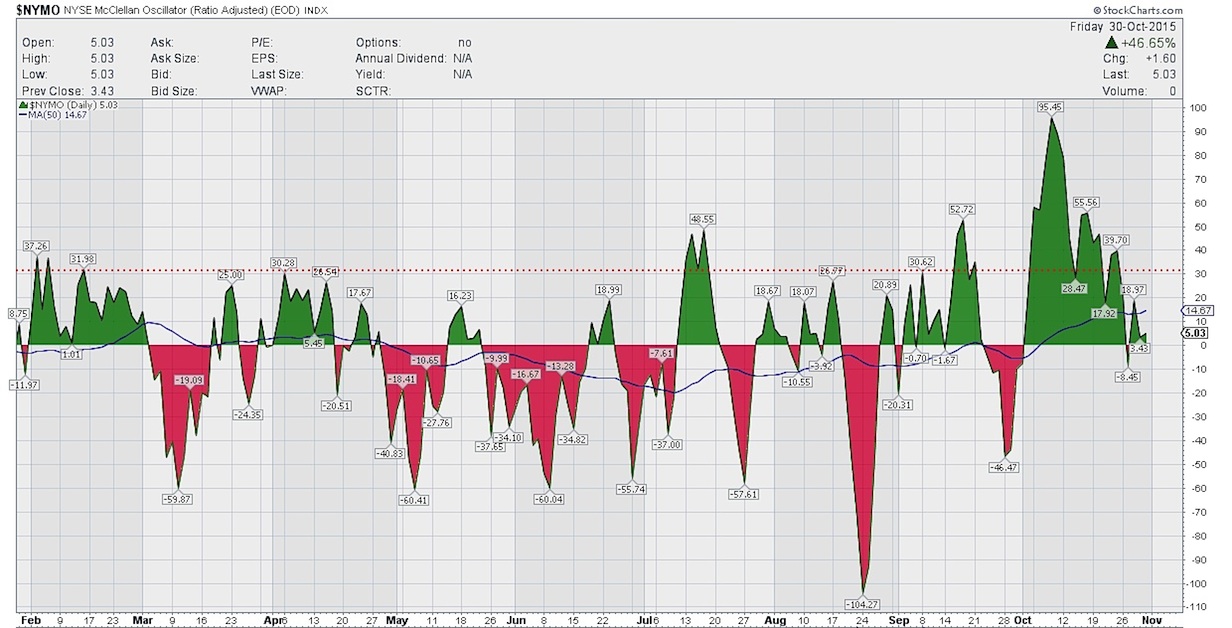
$NYMO (McClellan Oscillator):
With trading being choppy over the last week, $NYMO started to move lower during the week into the negative zone. But it did bounce.
continue reading on the next page…

 Testing Important Price Support")
: Cup (and Maybe Handle) Watch")

