After a week of back and forth headlines, all seemingly ended well for the Economic Modern Family of stock market ETFs we follow.
Oh sure, they still seriously underperform the big guns S&P 500, NASDAQ 100 and the Dow Jones Industrials.
And within the Family of ETFs itself, “Sister” Semiconductors (SMH) keeps thumbing her nose at the rest of the clan, especially at “Granny” Retail (XRT).
Two big news items came out on Friday:
One, the victory of Boris Johnson, which could mean an official move by Britain to exit the EU.
Second, the Phase One deal that Trump and China are “aiming” to sign.
Of course, this deal comes with the usual caveat, “it would still be wise to be skeptical of whether China would deliver on certain agreements.” Lighthizer
Hence, The Visible Man, a vintage kit from 1959 that needs assembly.
As a science assembly project, its purpose is to create a 3D version of a complete skeleton.
However, in researching the kit, I remembered the book by the same name written by Chuck Klosterman, published in 2011.
Way more fascinating, the book thematically touches on the way media transforms reality, the meaning of culture, and the dissonance of self-perception.
In a nutshell, a therapist is contacted by a cryptic, unlikable man who insists his situation is unique and unfathomable.
Unsure of his motives or honesty, the therapist becomes obsessed with her patient and the disclosure of his increasingly bizarre and disturbing tales.
Over time, it threatens her career, her marriage, and her own identity.
If this all sounds vaguely familiar, you are not unique, nor is the notion unfathomable.
The market has several visible men that are not only assembled in 3D, but also larger than life.
If we investors are the therapist, obsessed and disturbed by the nature of the market’s transformed reality and dissonance of self-perception, how do we prevent that from threatening our financial well-being?
Of course, we look to the Economic Modern Family’s weekly charts for answers.
To review, the “inside” of the market is the best measure for the true economic picture, regardless of economic stats, trade news, geopolitical turmoil and the like.
Most, not all, had a great week.
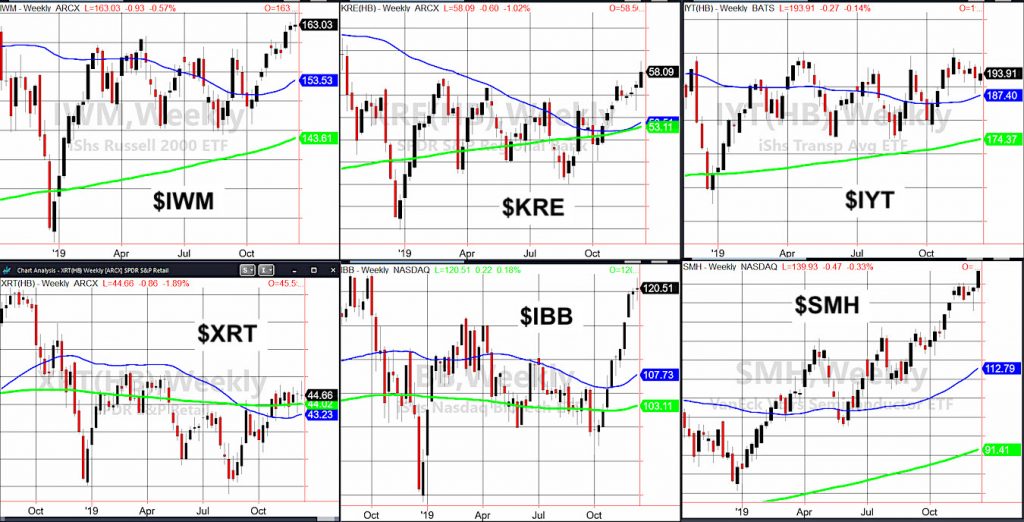
The Russell 2000 IWM was one that had a good week. Am I concerned it ultimately closed only slightly higher week to week in price, while the SPY, QQQs and DIA made new all-time highs?
Yeah, I am. However, concern is not anything more than that-concern
Regional Banks KRE also had a great week. It cleared the 2019 highs to make a new one.
Transportation IYT had an inside week. Another concern. Once again, big eyes here for the coming week to break the range one way or another.
Granny Retail XRT continues to be a concern, especially seasonally. While XRT tried to clear the most recent highs, with a weak retail sales report, instead XRT closed lower from a week ago.
Biotechnology IBB reflects investor appetite for risk. Noteworthy though, is that it matched the highs from October 2018 right before the crash. Bulls definitely wants to see those levels clear.
Then there’s our sister Semiconductors SMH. Highly visible, she is the best case for more upside, provided the rest of the Family hangs in there.
The Visible Man claims he can make himself invisible, however, the therapist thinks him delusional.
Such is the same with the market and its visible men.
Maybe that’s why I like the Economic Modern Family so much. Like a good therapist, they see the difference between delusion and reality.
S&P 500 (SPY) 313.60 or the 10 day moving average is price support, with 318.67 standing as the new all-time high.
Russell 2000 (IWM) 163.41 is pivotal price – still $9.00 away from the all time highs. Price support at 162 needs to hold.
Dow (DIA) 279.20 is the price support with a new all time high at 283.61
Nasdaq (QQQ) 204.15 or the 10 day moving average as support with 207.91 as the all time highs.
KRE (Regional Banks) 57.52 is now price support.
SMH (Semiconductors) 134.15 or the 10 day moving average is support, with 141.93 standing as the new all time highs.
IYT (Transportation) 195 is still the price area to clear with 191.25 as key support.
IBB (Biotechnology) 116.30 is key price support, 122.97 is the 2018 high.
XRT (Retail) 45.41 is a must clear, while 44.15 is major price support.
Twitter: @marketminute
The author may have a position in the mentioned securities at the time of publication. Any opinions expressed herein are solely those of the author, and do not in any way represent the views or opinions of any other person or entity.


