After periods of extreme complacency, we are often met with times of severe reversals.
This has been the case for the VIX Volatility Index () which is often called the “fear gauge” over the course of the last several years.
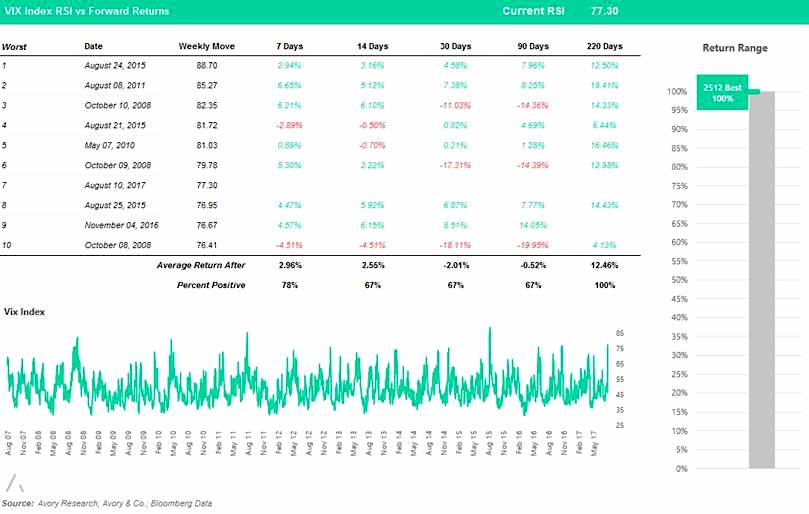
This morning, the Relative Strength Index (RSI) on the VIX spiked to 77.30 (and over 80 this afternoon). This is no little move and is the 7th highest daily reading over the last ten years.
For perspective, this data point sits in the 99-100 percentile overall. We went ahead and looked at the top 10 readings overall and measured the forward returns of the S&P 500. More simply, the readings are rather green. We do notice that the range of returns contrasts significantly as shown by the high teen drawdowns in the 2008 period.
In our view, one definite term sticks out. After 220 days, which is typically one year worth of trading days is positive 100% of the time. This isn’t perfect, nor does it significantly influence investment decisions, we do however hypothesize that fear can run too far, therefore leading to long term opportunities for investors. View the stats as you like.
Twitter: @_SeanDavid
Any opinions expressed herein are solely those of the author, and do not in any way represent the views or opinions of any other person or entity.


