Key Stock Market Takeaways:
– Cyclical rally challenged by deteriorating market breadth.
– Investor sentiment shifts but pessimism slow to build.
– Once selling ebbs, be alert for market breadth thrusts.
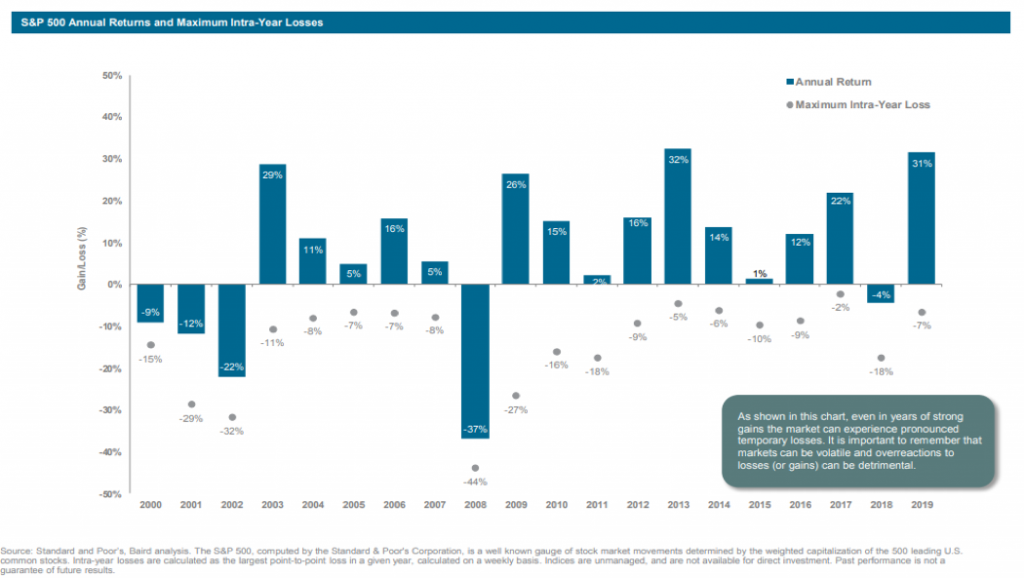
I discussed the prospect for heightened stock market volatility this year in our 2020 outlook, fueled in part by widespread complacency and elevated valuations. That became a reality this week. At its lows the S&P 500 Index was more than 10% below last week’s peak (at the time I’m writing this).
We haven’t even gotten to the end of February and are only a week removed from all-time highs in stock market indexes around the world and the S&P 500 has already matched or surpassed the peak-to-trough drawdowns seen in seven of the past eight years. Yes, stock market volatility has arrived. The relevant questions now are how to put this week’s weakness into context and what that might mean going forward.
While many of the headlines have attributed weakness in stocks to the uptick in coronavirus cases emerging around the world, we have actually seen relative leadership (i.e., smaller losses) from international stocks this week and stocks in both Hong Kong and mainland China are positive for February. Regardless of the proximate reasons for the weakness, it is relevant that this intense selling emerged so close to new all-time highs.
A study by Ned Davis Research shows that while rare this is not without precedent. In most cases, stocks at least attempt to rally back to their previous highs in coming months.
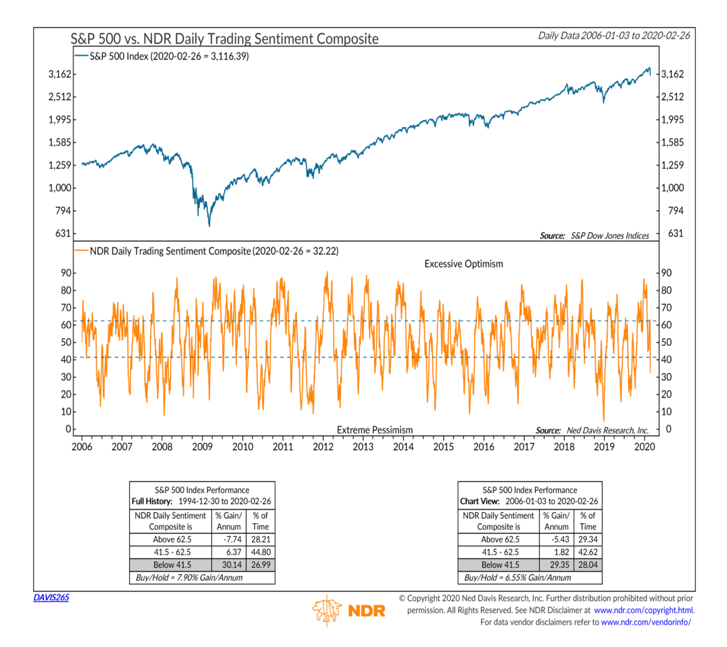
This week’s weakness has had a big impact on investor sentiment. Equity ETF’s have gone from seeing elevated inflows to a surge in outflows (to the tune of nearly $20 billion over the past week). Weekly surveys have shown a more muted response. While optimism has ebbed, rising stock market volatility has been slow to shake out a complacency that has become deeply engrained. Some evidence of short-term pessimism and fear has emerged.
The VIX Volatility Index climbed into the 30’s on Thursday, demand for put options has surged and the Daily Trading Sentiment Composite has collapsed. While encouraging developments for the near term, a broader re-set in investor sentiment would provide a more stable foundation for stocks.
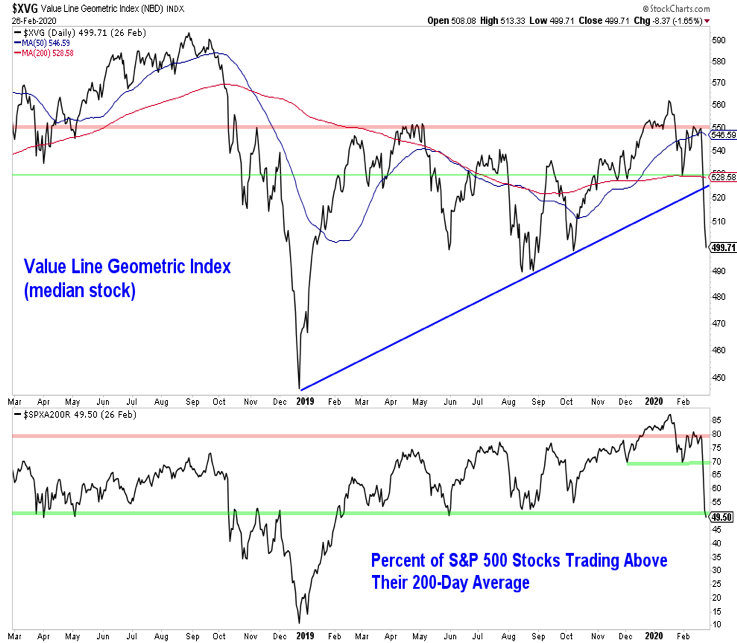
Two weeks ago, we discussed the need for broad market strength to confirm the new highs being seen on the S&P 500 and other indexes. That strength did not materialize and this week’s selling has led to pronounced broad market deterioration.
The Value Line Geometric Index, which is a proxy for the median stock has re-traced more than 50% of its rally off of the December 2018 lows (for comparison, this would be similar to the S&P 500, which closed on Wednesday at 3116 dropping to 2850). The percentage of stocks trading above their 200-day averages was above 85% in January and this week dropped below 50% (its lowest level in over a year). We will be watching the behavior of the breadth indicators closely on any index-level rallies that do emerge.
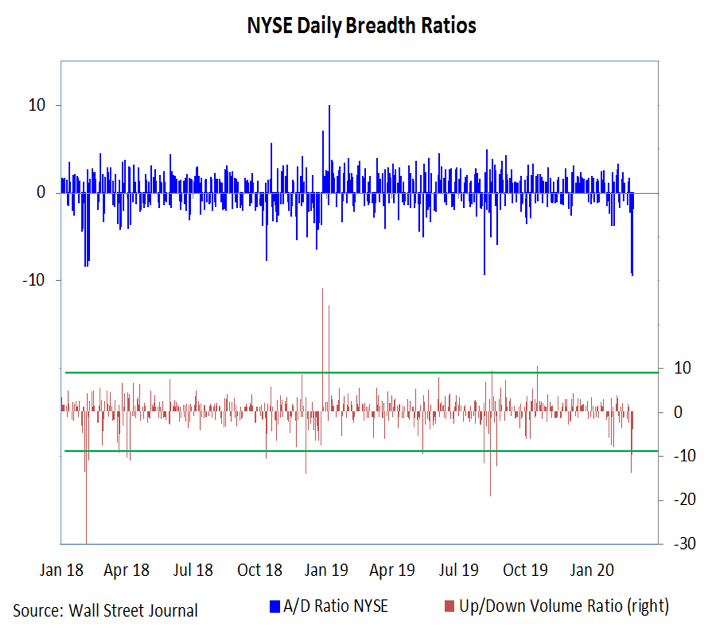
Deteriorating breadth has come as downside momentum has emerged. We have seen back-to-back days where down volume on the NYSE has outpaced up volume by more than 9-to-1. While this may ultimately yield an environment from which strength can emerge (more on that in a moment), we first need to see evidence that the uptick in stock market volatility has peaked and near-term downside risks are ebbing. Panic selling associated with spikes in the TRIN above 2 are a good first step. In the wake of such selling look for broad strength to emerge in the form of 9-to-1 up days (90% or more of the volume to the upside).
Further evidence that upside momentum is emerging and cyclical strength is sustainable would come from the breadth thrust indicators. The silver lining to the intensity of this week’s selling is that such an abrupt re-set provides a more favorable backdrop from breadth thrusts can emerge. Just as pushing a car down a hill can generate momentum to help it ascend the next hill, intense downward momentum can (and in the past has) provided fuel for upside momentum.
We will specifically be watching to see if the percentage of stocks above their 10-day average (currently less than 5%) or 50-day average (currently less than 25%) can climb above 90%. While too early to be seen right now, that is what we will be looking for as we move into March and the second quarter.
Twitter: @WillieDelwiche
Any opinions expressed herein are solely those of the author, and do not in any way represent the views or opinions of any other person or entity.


