The equity markets declined for the second week in a row. The S&P 500 Index (INDEXSP:.INX) fell below its 50-day moving average for the first time since May.
Small-cap stocks suffered the most with the Russell 2000 Index (INDEXRUSSELL:RUT) dropping below its 200-day moving average, falling back to levels last seen in the first quarter of the year.
The sudden rise in volatility (INDEXCBOE:VIX) breaks the unusual calm the markets have experienced this year. To date, there have only been seven trading sessions when the S&P 500 experienced a 1.0% move. The weakness in the stock market this month has been attributed in part to political tensions both at home and abroad. The seeds for the decline, however, were likely sown in mid-July as the broad market failed to respond to good second-quarter earnings. This suggested that near-term liquidity was exhausted.

The weakness in August also fits a long-standing trading pattern that finds stocks stumbling in the August to October time frame. Add to this the fact that the market is experiencing the longest spell in 20-years without a 5% correction the stage was likely set for the period of low volatility to be disrupted. Over the short term, it would not be surprising if the current weakness continued off and on into next month.
The Federal Reserve meets on September 20 and it is widely expected to announce the onset of the balance sheet reduction process. The Fed moving from a bond buyer to a bond seller in addition to potentially contentious discussions on the federal government budget and debt ceiling next month offers sufficient uncertainty to warrant a continued cautious approach. The September events could also set the stage for a stock market recovery as the wall of worry reaches a pinnacle.
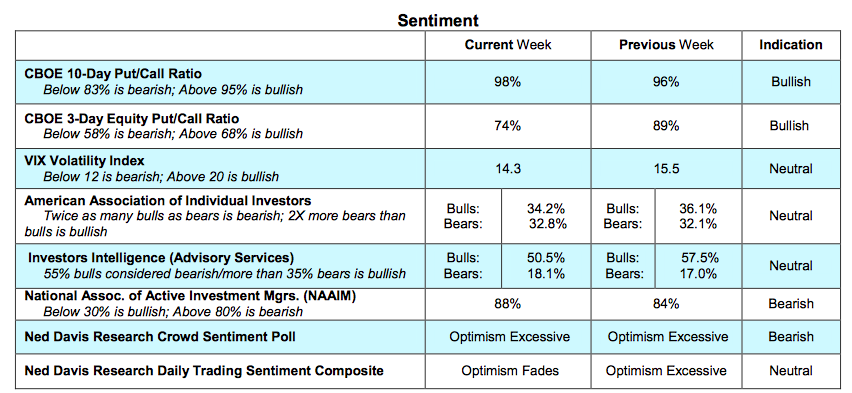
The technical backdrop improved last week in terms of sentiment, but this was offset by deterioration by the broad market. The CBOE reported a significant increase in the demand for put options for the second straight week (investors buy puts anticipating a market decline). The Investors Intelligence data showed a drop in bulls, but we would need to see the percentage of bulls fall below 40% to signal a bottom is close. On the other hand, the latest report from the National Association of Active Investment Mangers (NAAIM) shows a historically high allocation to stocks at 88%. Before a market low is in place we are likely to see NAAIM data show less than 60%.
The performance of the broad market since mid-July continues to deteriorate. Last week witnessed a contraction of the number of issues hitting new 52-week highs and an expansion of stocks making new lows. The number of S&P 500 issues trading above their 50-day moving average plunged to 42% last week and only 64% are trading above their 200-day moving averages. To argue that a low is in place we would likely need to see the number of issues making new 52- week lows contract on further weakness in the averages. Support for the S&P 500 is anticipated to be in the vicinity of 2375 to 2400 with resistance at 2460.
Twitter: @WillieDelwiche
Any opinions expressed herein are solely those of the author, and do not in any way represent the views or opinions of any other person or entity.


