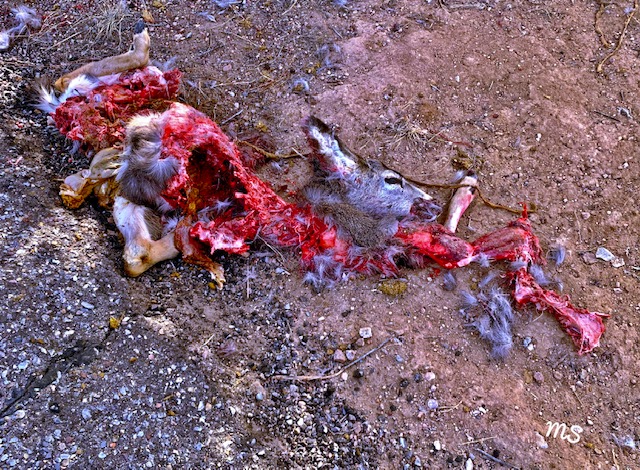
Sorry if my use of this reference (or my picture) for today’s stock market grosses you out.
Even in nature’s cruelty, there is beauty.
This unfortunate deer is right across the road from our house.
At every passing minute, more and more scavengers show up to eat its remains.
So far I have seen coyotes, fox, and three species of birds all feasting away.
Naturally, the scene reminds me of the current stock market environment.
Instead of topping out as the shooting stars candles suggested it might do, instead, the S&P 500 (SPY), Nasdaq 100 (QQQ) and and Dow Jones Industrials (DIA) ran to new all-time highs, while the Russell 2000 (IWM) saw new 2019 highs.
At this point, one has to wonder who is buying up here?
After all, if you are not already long and taking some profits, that could make you a scavenger, feeding off the remains of the unfortunate dead bears.
One perfect example is Tesla’s stock NASDAQ: TSLA
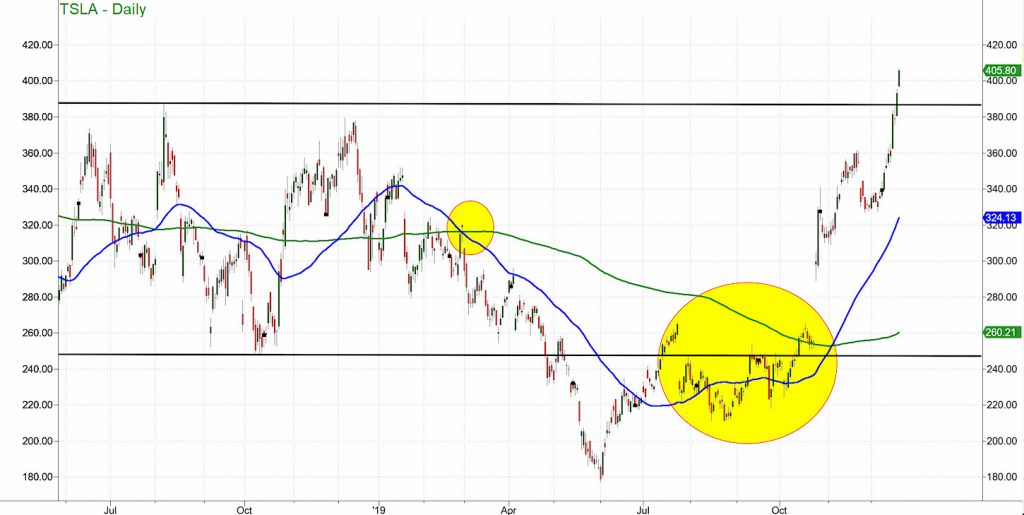
I really like channels, especially ones as beautiful as the one we have in Tesla TSLA.
The 2 black parallel lines are the channel that goes back to 2017.
The high of the channel tested in early fall 2018 was around 385.
The bottom of the channel tested in October 2018 was around 250.
Up until spring 2019, price action was perfectly in line with the channel.
Every time the price hit the top, it was time to sell and every time it hit the bottom it was time to buy.
Then, the bears became emboldened in late April when the price broke below 250.
Man, did we read negative comments about Musk and the company.
However, love him or hate him, Musk prevailed.
The large yellow ellipse on the chart shows the return into the channel with the eventual bullish or golden cross of the 50 and 200 daily moving averages.
With a gap higher after earnings late October, off the stock went.
Our NASDAQ All-Stars Model bought TSLA at $316, once the trend strength indicator signaled it was a buy.
We took our first profit at $380 and hold the balance using our trading strategy for handling next profit target and stops.
Bu the bigger point is that the stock has now broken out above the channel high.
And that’s where the scavengers come out.
What better way to stick it to the shorts, then feed on their carcass as the price climbs over $400.
However, in the laws of nature, a predator can become the prey.
In the overall market as well as in this stock, should the price trade below the channel line, bears will be back licking their chops.
S&P 500 (SPY) goes ex-dividend Friday. 317.05 or the 10 day moving average is price support. 320.98 is the new all-time high matched today.
Russell 2000 (IWM) 163.70 is price support with 165.10 pivotal.
Dow Jones Industrials (DIA) 281.75 is price support with all time high at 284.54
Nasdaq (QQQ) With a small breakaway gap, 207.05 or the 10 day moving average is support, with 210.75 as the new all time high.
KRE (Regional Banks) 57.52 is price support, 59.50 is resistance.
SMH (Semiconductors) traders want to see SMH hold 140.93, then 138.40 lower support. 142.22 is the all time high.
IYT (Transportation) 195 is still key pivotal price area with 192.35 as key support.
IBB (Biotechnology) 120.40 is price support, while 122.97 is the 2018 high.
XRT (Retail) 45.41 has been cleared and is now pivotal support. 46-47 is price resistance.
Twitter: @marketminute
The author may have a position in the mentioned securities at the time of publication. Any opinions expressed herein are solely those of the author, and do not in any way represent the views or opinions of any other person or entity.

: Worrisome to Broader Market?")
