Stock market futures traded up near yesterday’s highs this morning, a sign that bulls are defending the bears attempts at lower prices.
That said, the S&P 500 (NYSEARCA:SPY) remains largely unchanged for the last couple weeks… a tough tape to trade.
Bond Yields & Currencies
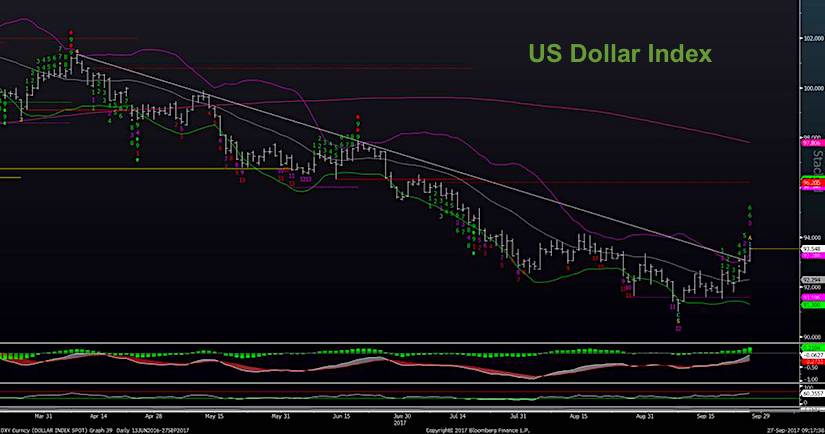
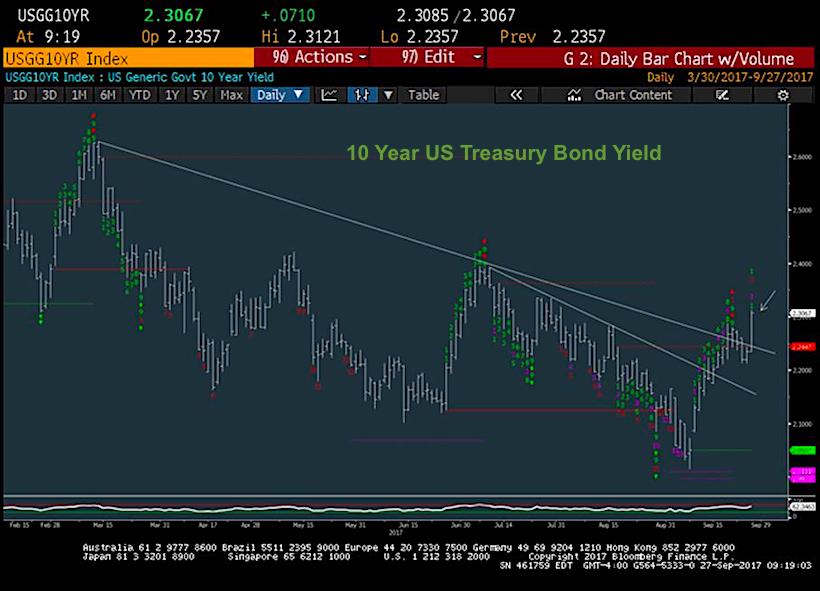
Treasury bond yields have broken out above the declining trend line from March and the 10 Year US Treasury Bond Yield now finds itself up around 2.30 – this is certainly something to note ahead of this GOP tax plan. As well, the US Dollar Index (CURRENCY:USD) is also breaking out, following through on the EURO violating key support against USD.
Equities
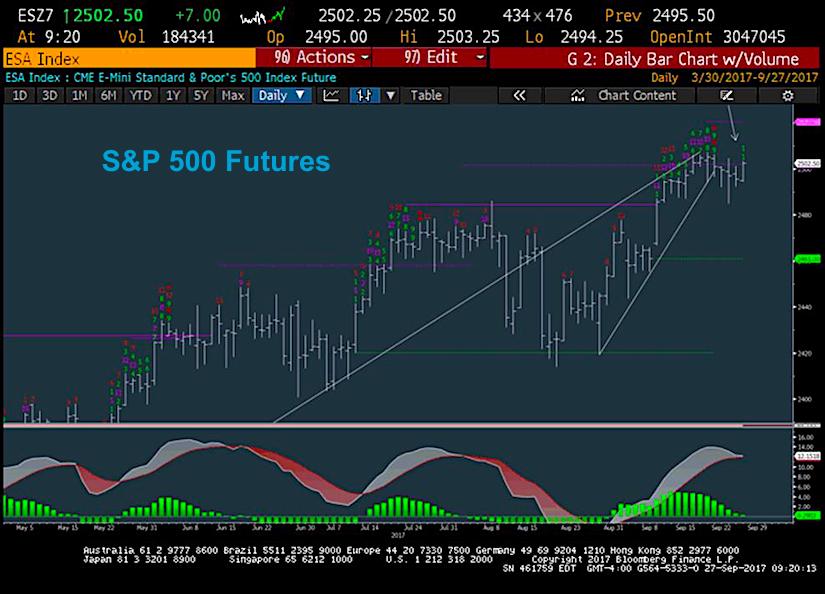
2504 is an important price line to watch on S&P 500 Futures. Near-term trends will turn more positive up ABOVE 2504, which would likely allow for a move to 2520-2525 into late next week. So this level will be key to hold for the Bears. UNDER 2485 would allow for deterioration to deeper support levels. IF this Tax plan is comprehensive, any pullback might be postponed until next week. As of now, this is premature to speculate on. And the key sectors to watch are Transports, Financials, and Small Caps as they are all up against important levels which are not technically breakouts… so still difficult to see where the strength will come from.
ALSO READ: S&P 500 Records Counter Trend Sell Signal
Here’s 3 charts that I’m watching today:
S&P 500 FUTURES
Minor sideways pattern has caused waning in momentum. But tax plan unveiling is resulting in prices gaining some ground (thus far).
US Dollar Index
The buck is breaking out this morning, following suit of the Euro’s breakdown yesterday vs USD. This should lead to further gains for the US Dollar in the near-term
10 Year US Treasury Note Yield
Breakout above the trend line from mid-March on 10yr yields. Getting up to 2.30% which is a minor positive for yields. That said, Financials (XLF) at 25.40 look to have limited upside from here.
We’ll see if this can hold throughout today, but a definite positive for yields if this holds today.
If you are an institutional investor and have an interest in seeing timely intra-day market updates on my private twitter feed, please follow @NewtonAdvisors. Also, feel free to send me an email at info@newtonadvisor.com regarding how my Technical work can add alpha to your portfolio management process.
Twitter: @MarkNewtonCMT
Author has positions in mentioned securities at the time of publication. Any opinions expressed herein are solely those of the author, and do not in any way represent the views or opinions of any other person or entity.
: Creating Bullish Divergence?")


 and Semiconductors (SMH): Concerning Price Pattern?")


