Last night I wrote about the price compression on the weekly chart for gold.
Today, the Gold ETF NYSEARCA: GLD closed green but did not take out 162 or the top of last week’s trading range high.
This is super exciting to watch unfold.
Will it clear?
And if so, how far can the price of Gold go up?
Plus, what are the real ramifications for the market?
Elsewhere, we have our Economic Modern Family telling its own story.
Remember I covered channels and wedges on the weekly charts through blogs and StockchartsTV?
Well, that was Season 1.
Today started Season 2.
The clear divergence between the up action in gold and the down action in stocks is noteworthy!
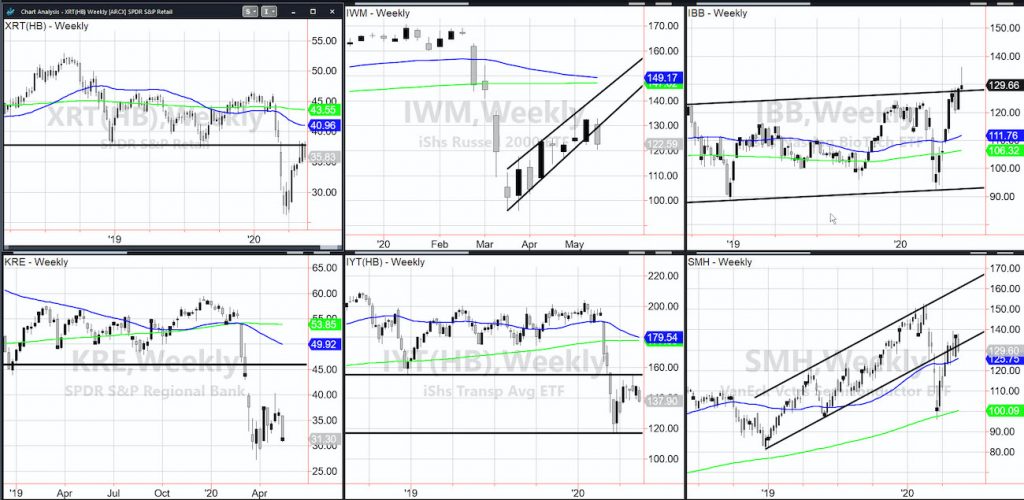
The Russell 2000 IWM, which showed us some promise last week, is now trading under the channel support line.
Sure, it can find support on the way down, but until it gets back over 130, I would not be so quick to buy.
Granny Retail XRT traveled right to the mall or the channel resistance, and turned back.
Prodigal Son Regional Banks KRE was the first to tell us that something was amiss with the new found bullishness.
Transportation IYT, like Granny, never cleared the channel resistance and now trades near the early April lows.
Perhaps the most interesting are the two superstars of the Family, Big Brother Biotechnology IBB and Sister Semiconductors SMH.
IBB is now touching the top of channel it traded in for the last five years. That’s huge. For those like us who did not buy it on this week’s pop, can now decide if this correction gives us a very cheap risk or not.
Semiconductors SMH or the big recent tech run, never has legs for too long once she realizes that her superwoman strength is not enough to save the rest of the Family.
Now, she has broken back down below the bottom channel line. But not by too much. Like IBB, if the market holds from here, a move back over 132 is worth considering, risking to below the 50-Week Moving Average at 125.77 (blue line).
If the lesson from gold today is a foreshadowing, then do not be in a rush to go long. Or if you do, keep the timeframes shorter.
S&P 500 (SPY) 285 is price resistance, while 278 is price support.
Russell 2000 (IWM) Landed right on the 50-day moving average at 120.25 (major support).
Dow (DIA) Landed right on the 50-day moving average at 229.90 (major support).
Nasdaq (QQQ) 221.80 is price resistance with 209 being the next major support.
KRE (Regional Banks) 30.00 held and must continue to hold; 33.13 is key price resistance.
SMH (Semiconductors) 132 is pivotal; 125.70 is price support.
IYT (Transportation) 140 is price resistance, while 136.40 is support.
IBB (Biotechnology) 128 is still important, with some fudge of course.
XRT (Retail) 33.50 is price support, while 37.15 is resistance.
Volatility Index (VXX) Closed under 40.00. A gap above compelling.
LQD (iShs iBoxx High yield Bonds) 127.50 is price resistance.
Twitter: @marketminute
The author may have a position in the mentioned securities at the time of publication. Any opinions expressed herein are solely those of the author, and do not in any way represent the views or opinions of any other person or entity.


