Although we’ve had a choppy week in the market, key areas held in the major indices showing upside potential for Monday.
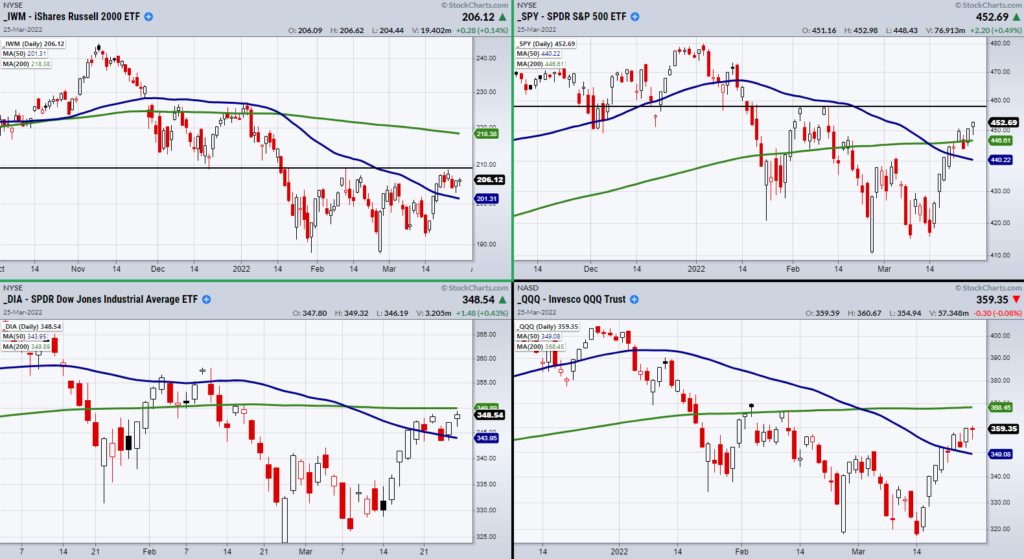
Currently, the main support levels are near the 50-Day moving average (blue line) in the Dow Jones Industrials (DIA), Russell 2000 (IWM), Nasdaq 100 (QQQ), and the S&P 500 (SPY).
If these support areas can hold, next we can watch for resistance areas to clear.
The most important resistance level to clear is in the Russell 2000 (IWM).
Not only does IWM have a large sample size of companies compared to the other major indexes, last week’s high at $208.79 lines up with the high from 2/10.
As seen in the above chart, this makes an important level to clear if the market is going to show strength next week.
On the other hand, the Dow Industrials (DIA) and the Nasdaq 100 (QQQ) have resistance from their 200-DMA (green line).
Lastly, since the SPY has already cleared its major moving averages, its most notable resistance level is the double peak high at $458.
With that said, here are two trading ideas to watch for in the coming week.
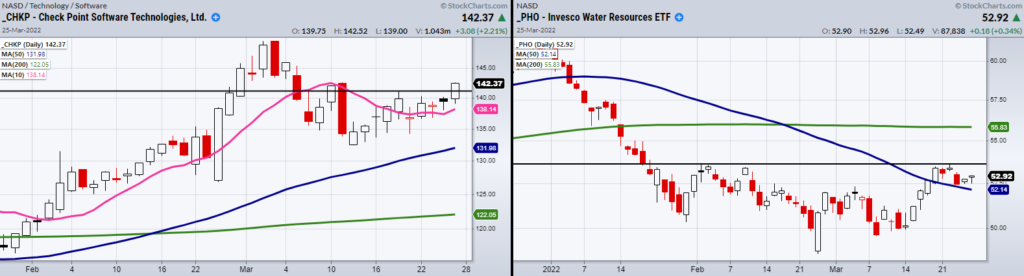
The first is Invesco Water Res ETF (PHO).
Water is a safety play based on rising inflation and food shortages brought by supply chain disruptions.
PHO is sitting over its 50-DMA in a recuperation phase and if it can hold over the MA at $52.14, it has the potential to make a run towards $56.
One key level to clear and hold over is $53.65.
Flipping over to momentum play, Check Point Software (CHKP) is a technology company focused on security and internet bandwidth management.
More susceptible to overall market price action CHKP needs to be watched along with major indices either clearing resistance or holding support areas.
Having just cleared over resistance from $141 CHKP should hold over this level and ideally not close under its 10-DMA at $138.
Watch Mish’s most recent video about which meme stocks to buy!
Stock Market ETFs Trading Analysis & Summary:
S&P 500 (SPY) price resistance at 458
Russell 2000 (IWM) 209 is price resistance.
Dow Jones Industrials (DIA) 350 is price resistance.
Nasdaq (QQQ) needs to hold 350. Price resistance at 368.
KRE (Regional Banks) 69.28 is the 200-day moving average.
SMH (Semiconductors) 273.95 is pivotal.
IYT (Transportation) 270.60 is price resistance.
IBB (Biotechnology) Flirting with the 50-day moving average at 128.06
XRT (Retail) 75.62 is price support area.
Twitter: @marketminute
The author may have a position in mentioned securities at the time of publication. Any opinions expressed herein are solely those of the author and do not represent the views or opinions of any other person or entity.


: Showing Some Signs of Emerging Strength")
