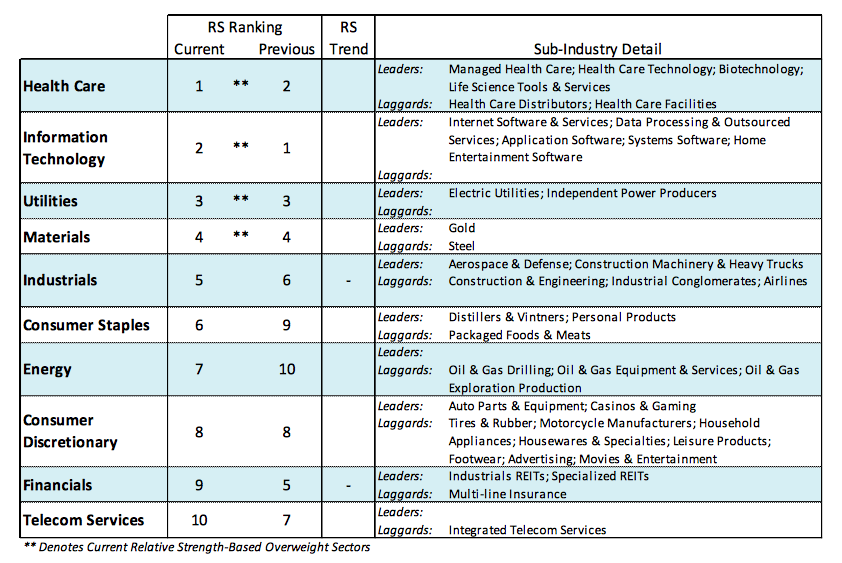
The equity markets remain elevated with the S&P 500 (INDEXSP:.INX,) and Dow Jones Industrials (INDEXDJX:.DJI) sitting at record highs. The move to new highs is finding leadership via the Industrials Sector (NYSEARCA:XLI) and the Materials Sector (NYSEARCA:XLB).
Stocks are being supported by improving global economic conditions and by a growing consensus that tax relief could become a reality in 2017. As a result, the prospects for further near-term gains have improved.
Looking further out, we would anticipate that if a new leg in the bull market is developing it would likely be preceded by a breath thrust that would include at least one session where upside volume exceeds downside volume by a ratio of 10-to-1 or more. Further confirmation that stocks are breaking out of an intermediate-term trading pattern would include new highs by the small- and mid-cap averages that have lagged the S&P 500 in the second half of the year.
The focus of attention this week will be on the Federal Reserve Board which meets on September 19 and 20. The Federal Reserve is widely anticipated to announce its balance sheet normalization process and commence its securities runoff in October. More importantly, Janet Yellen faces no great urgency to raise the level of fed funds in 2017 considering inflation remains below Fed targets and given the uncertainty surrounding the economic effects of hurricanes Harvey and Irma. Investors should focus on the strongest performing sectors that include the industrials, materials and health care sectors.
Market Summary Brief
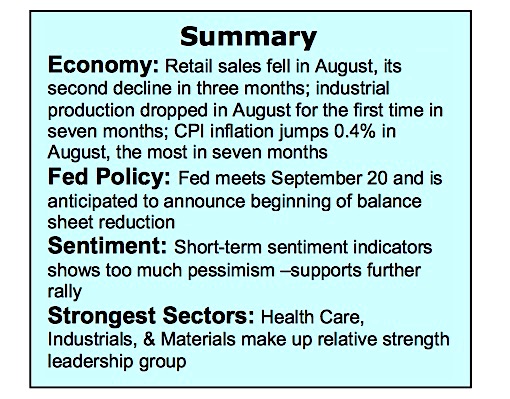
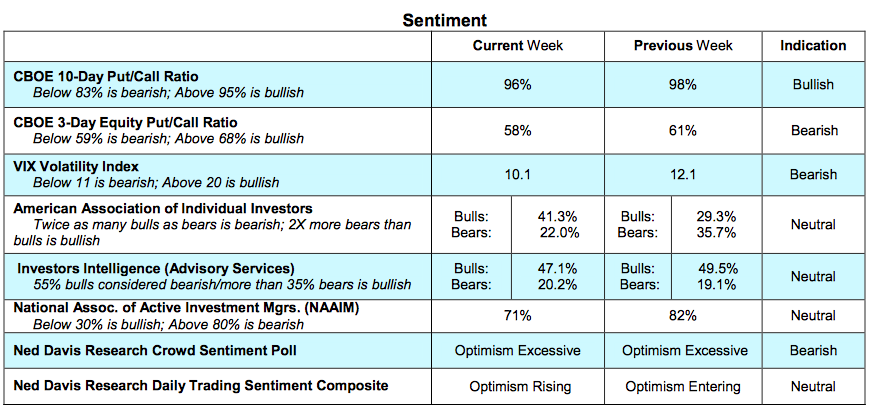
The technical indicators for the stock market are mixed. Sentiment indicators show that investor optimism found early in the third quarter is reversing. This can be seen in the latest report from Investors Intelligence (II) and data provided by the Chicago Board of Options Exchange (CBOE) that shows the demand for put options expanding. Using contrary opinion, the shift in sentiment is a favorable near-term development. Longer-term measures of investor sentiment, however, remain a concern. Margin debt is at or near an all-time record high ($550 billion), double what was seen at previous stock market peaks. Cash levels as represented by investor accounts in money market funds, stock mutual funds and ETFs are at an all-time record low suggesting long-term optimism is elevated.
Measures of stock market breadth offer a similar message. Short-term improvement is seen in the expansion of issues hitting new 52-week highs the past two weeks and the contraction in the number of stocks reaching new lows. Longer-term breadth issues, however, remain unresolved. Despite the rally to new highs by the S&P 500 Index only 68% of S&P 500 stocks are trading above their 200-day moving average, down from 83% in February and 77% in July. Additionally, less than 60% of the industry groups within the S&P 500 are in defined uptrends, down from 80% in the first quarter of the year. To gain confidence that the recent rally is the start of a new bull leg we would expect to see an expansion in the percentage of industry groups in the S&P 500 climb above 75%.
Thanks for reading.
Twitter: @WillieDelwiche
Any opinions expressed herein are solely those of the author, and do not in any way represent the views or opinions of any other person or entity.


 Ready To Break Out?")

")
