The Simplest & Most Rounded Way to Look at Price
Back in the days on the Commodities Exchanges, we had no social media and little in the way of technical indicators.
But what we had was PURE price action.
In that spirit, today, we have everything a trader could hope for and probably too much of it.
That does not mean thought, that we do not have a way to track the markets in a simpler fashion-and do it with some pizazz.
Geoff, Keith and I all come from the floor.
As a result, we use the notion of pure price in our proprietary indicators.
We look at pure price action with phases.
We look at momentum or a derivative of price with relative strength gauges.
And, we look at price leadership or under/overperformance using benchmarks.
In the short video, I cover the four stock market indices, gold, silver and one stock.
With regards to pure price, I look at the phase of each of the stock indices. With our Real Motion indicator, we look for anything disproportionate between price and momentum.
Then, with our Triple Play indicator, we look at several different benchmarks to determine whether the insturments I cover are under or overperforming.
We also go over actionable information for trading gold, silver and Bluebird Bio, a biotech stock. Watch here:
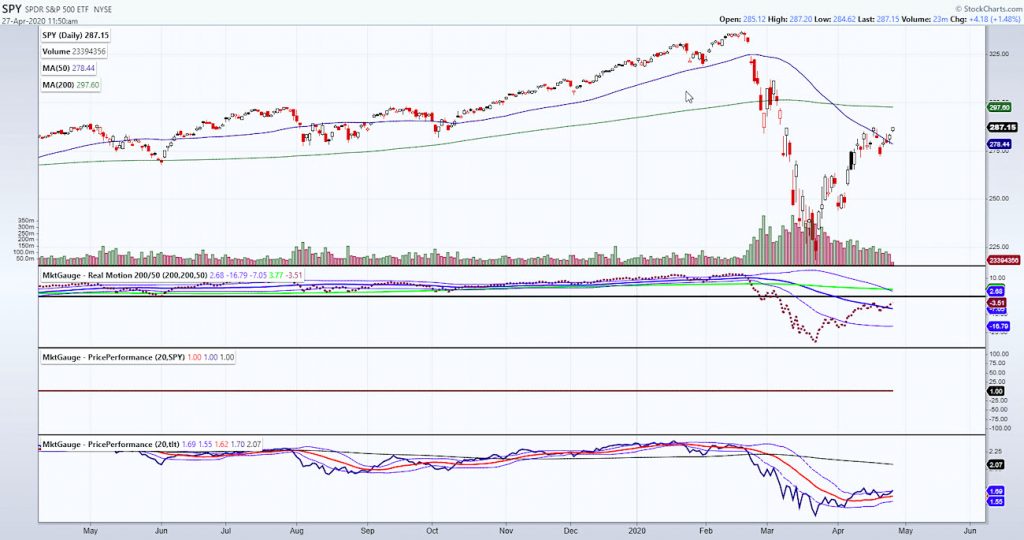
S&P 500 (SPY) Rallied into resistance at 287-288. Momentum is also into resistance so watch for a hold of 285 to stay healthy
Russell 2000 (IWM) Rallied right to the 50-DMA. However, momentum gained and this is nearly in line with SPY’s relative performance
Dow (DIA) In an unconfirmed recuperation phase with momentum and price performance into resistance. 235 resistance then 237.45. Support 225-226
Nasdaq (QQQ) Ran into resistance at 216, with momentum slowing and relative performance beginning to show some fatigue.
KRE (Regional Banks) 37.52 resistance with momo also at resistance
SMH (Semiconductors) Ran into resistance at 134, with momentum still ok and relative performance beginning to show some fatigue.
IYT (Transportation) 150 resistance as this approaches the 50-DMA. Mometum gaining though while price performace still lags
IBB (Biotechnology) Momemtum indicators hit the highs of 4/20. Plus, this is beginning to show some fatigue versus the SPY
XRT (Retail) Big breakouts everywhere. Amazon has helped this sector. For now, the place to be
Volatility Index (VXX) Sitting right on the 50-DMA
Junk Bonds (JNK) 96 support to hold. 98.35 resistance
LQD (iShs iBoxx High yield Bonds) More sideways than negative at this point
Twitter: @marketminute
The author may have a position in the mentioned securities at the time of publication. Any opinions expressed herein are solely those of the author, and do not in any way represent the views or opinions of any other person or entity.
: Creating Bullish Divergence?")


 and Semiconductors (SMH): Concerning Price Pattern?")


