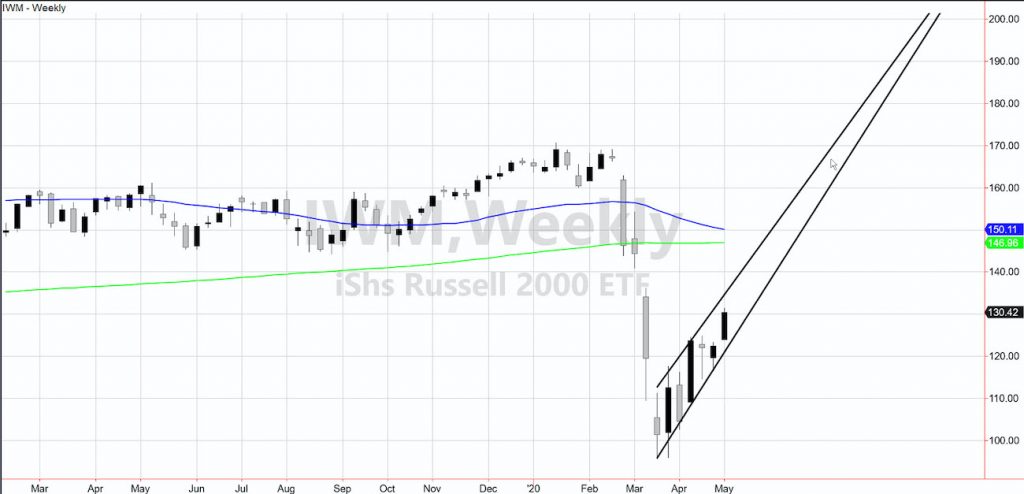
Russell 2000 ETF NYSEARCA: IWM “weekly” Chart
Whether today was a key reversal or just some liquidation and digestion after the recent move up remains to be seen.
But with the week and the month ending, we will have a better answer as we head into next week.
Plus, with lots of earnings reports on tap, we will also find an emerging leader.
Note the weekly chart on the Russell 2000 ETF (IWM) and the picture-perfect channel.
S&P 500 (SPY) 288-290 pivotal support as this enters a new level of resistance between 295-300.
Russell 2000 (IWM) 130 support then 125-over 130 resistance 134.50
Dow (DIA) 249 resistance 238 support
Nasdaq (QQQ) 216-217 support 222 resistance
KRE (Regional Banks) 38.10 support to hold
SMH (Semiconductors) 135 pivotal, 129-131.50 support. 140 resistance
IYT (Transportation) 155 resistance 150 support
IBB (Biotechnology) 121.75 support 125 pivotal
XRT (Retail) 38.50 is huge resistance with 35.00 support
Volatility Index (VXX) 40-41.00 area to clear
Junk Bonds (JNK) Confirmed recuperation phase-102 resistance
LQD (iShs iBoxx High yield Bonds) Money rotated into junk and out of high grade-but still sideways.
Twitter: @marketminute
The author may have a position in the mentioned securities at the time of publication. Any opinions expressed herein are solely those of the author, and do not in any way represent the views or opinions of any other person or entity.


 Trading Into Inflection Point")


