Black Friday and Cyber Monday posted record sales.
Yet Amazon (AMZN), and many of the retail stocks that saw huge gains last week, fell today. As did the broader stock market.
The brick and mortar retail ETF (XRT), on alert for a move higher, also dropped by over 1 percent.
In other news, while Americans blissfully bought multiple items on sale thereby increasing their household debt, many other areas of the globe continue to revolt against oppression.
Rising food and raw material prices have soared, particularly in emerging markets.
That has widened the gap between the wealthy and the masses in many of these revolting countries, most notably throughout Central and South America.
To add to the disconnect between the sentiment of the U.S. and elsewhere, the Federal Reserve stated today that they are considering raising the optimal inflation rate of 2% to higher.
So while petrol, food and minerals show massive inflationary signs outside of the U.S., inside the U.S., the Fed’s metrics continue to point towards lagging inflation.

That brings us back to the U.S. stock market.
Given strong U.S. consumer sentiment against a much angrier world sentiment, which dog are you in this proverbial fight?
A bull, bear or simply agnostic?
If you choose bull, then these charts support that position as both are above key weekly moving averages.
Amazon sits above the 50-WMA (blue line).
XRT sits above the 50 and 200-WMA (blue and green lines.)
Therefore the bulls in this fight can say with authority that both instruments are holding support.
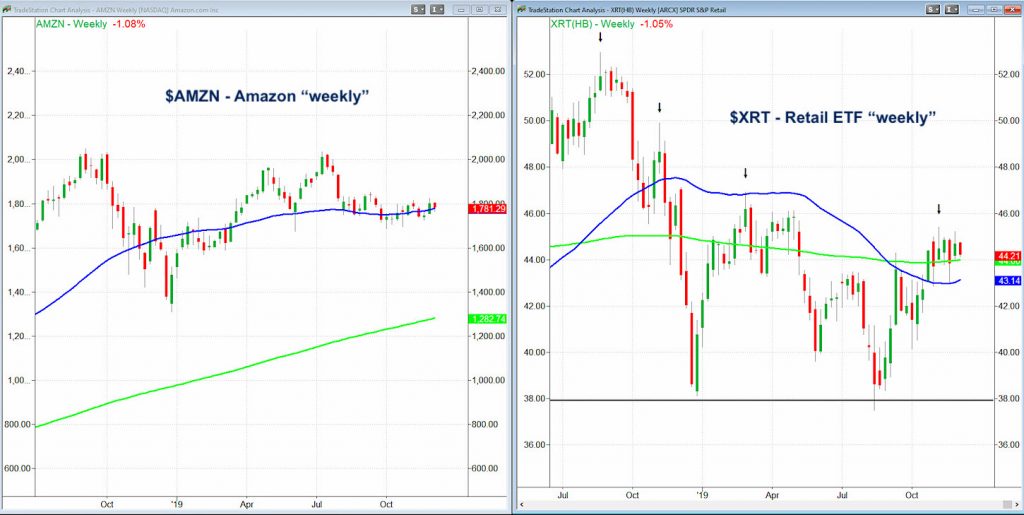
If you choose bear, then these charts support that position as well.
On a day that kicks off seasonal buying in retail, especially given the strong cyber sales, Amazon’s decline in price shows a weak price reaction realtive to strong news.
XRT, with its pattern of lower highs since July 2019, also emboldens the bears, as this pattern has yet to negate.
If you choose agnostic, then these charts equally support that position.
Yes, the price action is disappointing as we start the final month of the year. However, that price action is also not breaking any new ground.
Both Amazon and XRT are trading inside last week’s trading range or what you can call stalled.
At this point, with Transportation red and Semiconductors threatening to fill the breakaway gap which indicates exhaustion if not further weakness, I consider myself an agnostic in this dog fight.
I am expecting higher inflation and slower growth. But that does not mean I am a bear-at least not yet.
Inside weeks are reliable indicators for traders to take a stance when the range reconciles.
If you subscribe to RealVision, here is my segment in Technical Trader where I go into detail about the upcoming macro picture. https://www.realvision.com/tv/shows/technical-trader/videos/betting-on-benchmarks?source_collection=9ac2e47e08a84d3d88dfcea6ffc99f3e
S&P 500 (SPY) 312 is the pivotal support.
Russell 2000 (IWM) 160.46-161 is pivotal to hold and clear.
Dow Jones Industrials (DIA) 280 is pivotal.
Nasdaq (QQQ) 203.15 is pivotal.
KRE (Regional Banks) 56.00 is pivotal.
SMH (Semiconductors) Max area of price support to hold the breakaway gap is 130.20
IYT (Transportation) 195 is pivotal with 190 serving as price support.
IBB (Biotechnology) 116.30 is key price support.
XRT (Retail) 44 is price support and 45.41 is resistance.
Twitter: @marketminute
The author may have a position in the mentioned securities at the time of publication. Any opinions expressed herein are solely those of the author, and do not in any way represent the views or opinions of any other person or entity.


