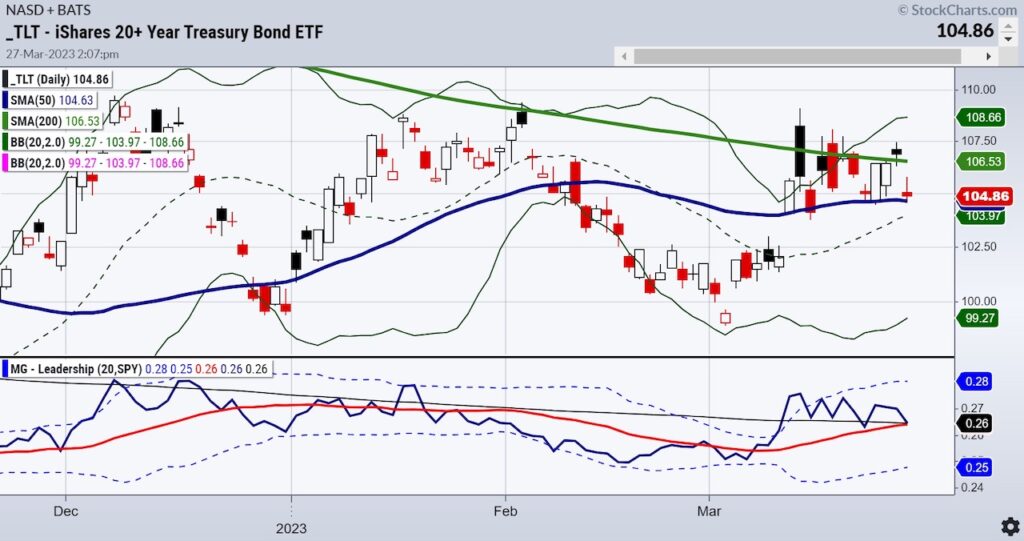
From Friday to Monday, trading on the Treasury Bond ETF (TLT) took a turn lower.
Below you can see the charts.
Friday:
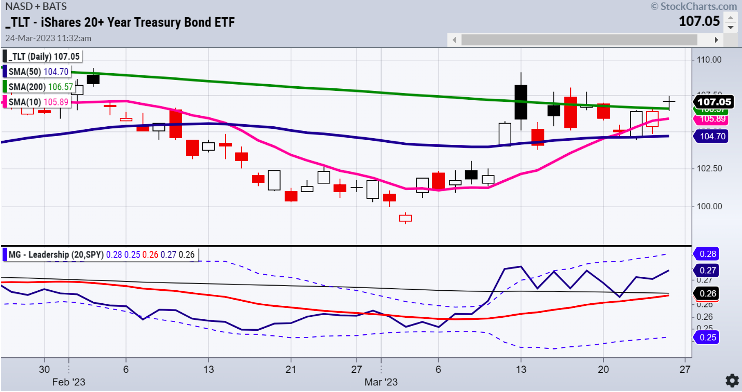
Monday:
Over the weekend, our Daily covered 3 key ratios to help decipher the market action and the prevailing macro theme for the economy.
We started with the one between long bonds (TLT) and the S&P 500 (SPY).
All last week, long bonds outperformed the SPY with calls for recession.
This week so far, bond yields rose to 3.5%.
While gold declined a bit along with semiconductors, WTI crude oil was up $70 a barrel and grains along with sugar prices rose.
Looking at the TLT: SPY Monday, TLTs now are performing on par with SPY.
Recession fears over, hello stagflation?
Then, as if to support the stagflation theory with yields rising and the indices in a trading range, silver continues to outperform gold.
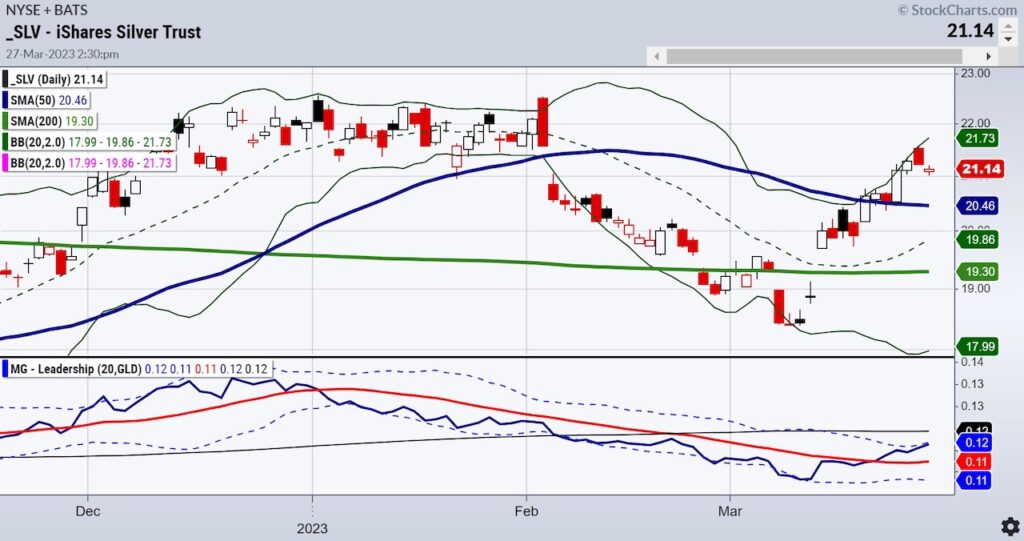
Although silver prices also fell some, the ratio between silver and gold enters “inflation worry” zone.
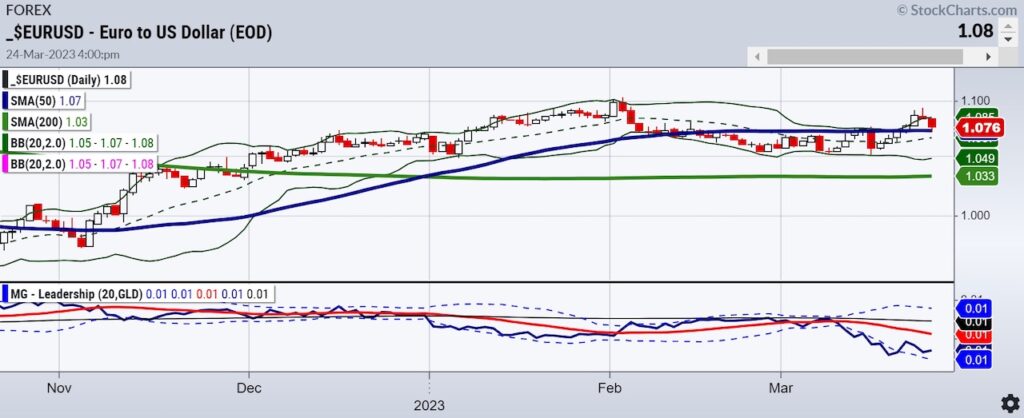
For the 3rd ratio, we continue to look at the dollar to the Euro for clues.
The dollar typically goes up when interest rates do.
Yet the dollar declined against the Euro, now at 1.07.
So we have yields rising, silver outperforming, and the dollar declining.
Our Small Cap All-Stars Model had the best daily returns Monday after the bank issues began with good news.
The Russell 2000 IWM could see a further bounce from here. Yet remains stuck in a trading range.
At least, we are not seeing IWM head into recession territory.
Good news, market is optimistic about avoiding recession.
Bad news, market has not dealt yet with the possibility of stagflation.
And then there is bitcoin.
A note on Bitcoin from Holden and his weekly Cryptocurrrency update:
The most likely scenario from here is that we’ll see Bitcoin go sideways for a short while in this new range until a new piece of major news comes out to force a break one way or the other. In the event of a breakdown from here, we would expect BTC to find support around the $25,000 level, while the clear target from here is to take out the psychological $30,000 level on a daily closing basis.
Stock Market ETFs Trading Analysis & Summary:
S&P 500 (SPY) Needs to clear 400 and hold 390
Russell 2000 (IWM) 170 held-so maybe the ratios are implying no recession after all-180 resistance
Dow (DIA) 325 cleared now needs to hold
Nasdaq (QQQ) 305 support 320 resistance
Regional banks (KRE) Daily up reversal. Weekly more inside the range of the last 2 weeks
Semiconductors (SMH) Follow through on that key reversal w/ 250 support
Transportation (IYT) 219 is a level that has been like a yo-yo price
Biotechnology (IBB) Held key support at 125 area-127.50 resistance
Retail (XRT) Granny held 60-still in the game-especially since that is the January calendar range low.
Twitter: @marketminute
The author may have a position in mentioned securities at the time of publication. Any opinions expressed herein are solely those of the author and do not represent the views or opinions of any other person or entity.


