Stock prices rose for the second week in a row with the S&P 500 Index, NASDAQ Composite, and Dow Jones Industrials hitting a series of new highs last week.
The stock market remains resilient as investors continue to view the coronavirus as a temporary situation.
While the uncertainties of the virus remain very much in the headlines, the likely economic setback is offset to a certain degree by better-than-expected corporate earnings announcements, new trade deals with China, Canada, Mexico and Japan and solid economic data.
Unemployment remains low, wages are rising, the labor force participation rate is the highest since 2013 and existing home sales are rising.
The Reuters/University of Michigan Consumer Sentiment Index increased in early February to its highest level in nearly two years. The consumer continues on a positive track and this argues that consumption and services (70% of GDP) will remain solid in spite of a virus setback.
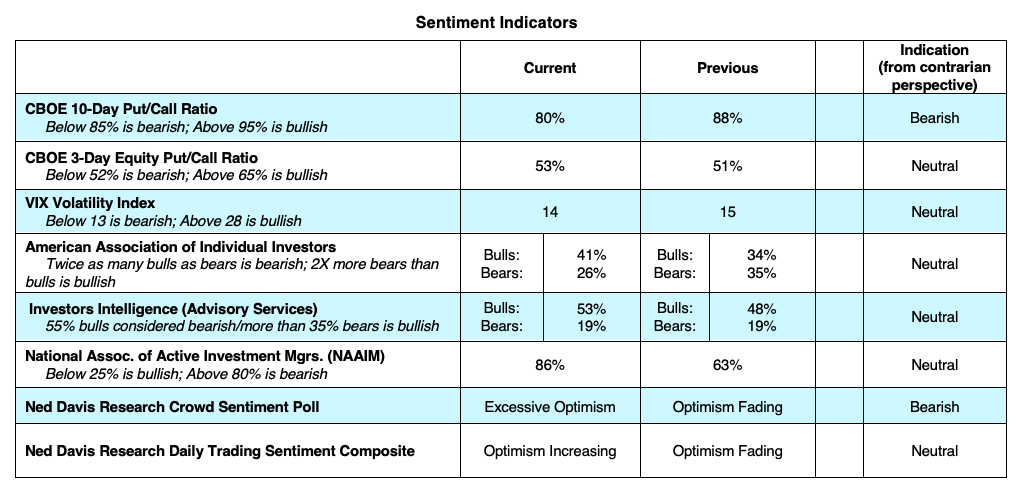
We rely heavily on investor psychology and liquidity measures to provide advance warning of major market turning points. Investor sentiment indicators typically show excessive optimism prior to an important market peak.
Excessive optimism suggests that most are fully invested signaling market liquidity has been diminished. Our indicators are currently mixed but don’t show excessive optimism. See featured chart at top of article.
Some key sentiment indicators that we follow: Investors Intelligence (survey of Wall Street letter writers) shows 53% bulls up from 48% the previous week. As a contrarian indicator, we would need to see 60% bulls to signal concern.
The American Association of Individual Investors currently shows 41% bulls and 26% bears. We would need to see two times as many bulls than bears for a sell signal. Ned Davis Research Trading Composite has a neutral rating on the stock market.
CBOE put/call ratios, however, are at the lowest level since January 2018 triggering a short-term sell signal.
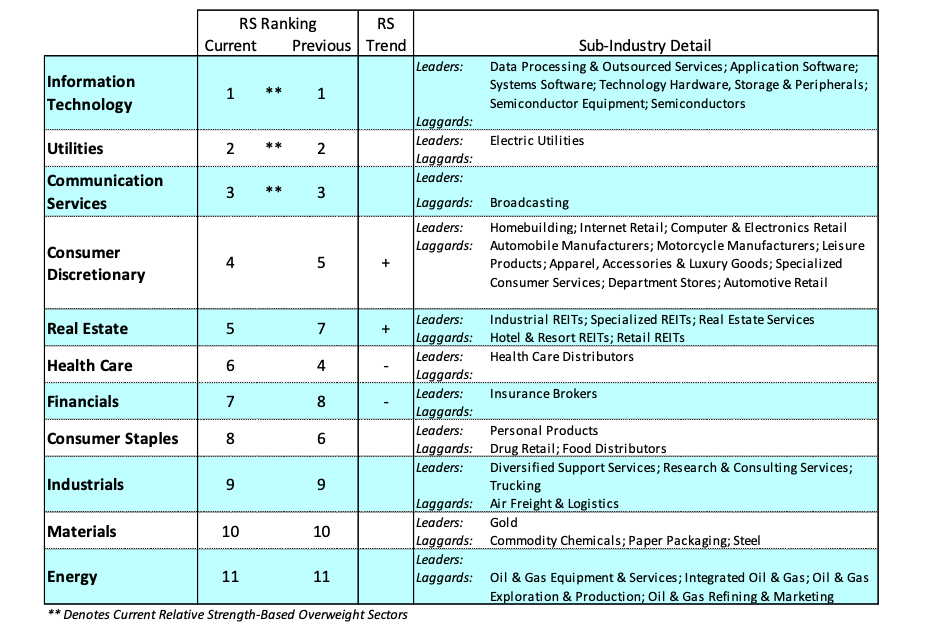
Breadth Indicators: Market breadth remains healthy with eight of eleven sectors within the S&P 500 making new highs last week. Nearly 80% of S&P 500 stocks are trading above their 200-day moving average. We would need to see deterioration in the breadth numbers to signal a pullback in the market.
Should optimism turn more aggressive we would expect to see a short-term pullback. Should excessive optimism be accompanied by deterioration in market breadth, we would be looking for a more meaningful reversal.
Prior to the coronavirus, we were beginning to see a rebound in global manufacturing. It is almost assured that the global economy will suffer a setback and likely spill-over into the U.S. economy.
Consequently, we may see first- and second-quarter economic numbers revised downward but we don’t think this will have a sustained impact on the U.S. economy as our economic fundamentals are strong, rates are low, the Federal Reserve is accommodative, and the consumer continues to spend, all suggesting a continuation of the bull market.
Twitter: @WillieDelwiche
Any opinions expressed herein are solely those of the author, and do not in any way represent the views or opinions of any other person or entity.

: Worrisome to Broader Market?")


