The stock market has been on shaky ground the past week or so. But this pullback is overdue, considering the big rally this spring. So this could be bullish consolidation… or it could be the initial stages of a bigger pullback. A potential stock market triple top on the Valu-Line Geometric index (if it holds) could spell trouble.
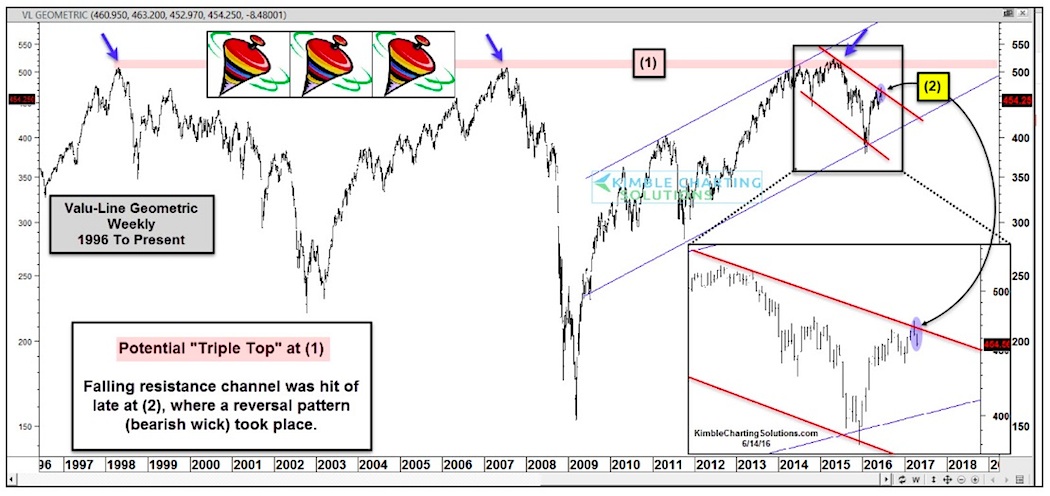
Moving away from the traditional S&P 500 or Dow Jones Industrial Average, today I want to focus on the Valu-Line Geometric – a broad index. The chart below covers the past 20-years.
As you can see, this important market index has the potential of confirming a stock market triple top. And it took 18 years to create, so it bears significant importance, in my humble opinion.
Think of it this way: A breakout above the 3 major tops would be huge for the bulls. However, while we remain below line (1), the market is vulnerable.
Let’s drill down a bit and shorten our time frame. Perhaps what’s taking place at point (2) is even more important. Over the past year this Valu-Line index has formed a series of lower highs and lower lows. The rally off the February lows has this stock market index testing falling channel resistance at point (2).
If we cannot breakout above resistance point (2), then we may see more selling pressure.
This falling resistance point could be a gauge of where stocks are headed over the next 6 months. And could also indicate if a stock market triple top is in play.
Thanks for reading.
More from Chris: Dow Jones “Megaphone Pattern” Defines Risk On/Off
Twitter: @KimbleCharting
The author does not have a position in related securities at the time of publication. Any opinions expressed herein are solely those of the author, and do not in any way represent the views or opinions of any other person or entity.


