THE BIG PICTURE
The broader stock market remains in an uptrend. Although geopolitical risks continue to linger, the best thing to do is follow the price action and avoid anticipation due to “noise”. If/When we enter a market correction, your process should stop you out of the trade.
Without further adieu, here’s my weekly futures trading update and outlook. We’ll start with the S&P 500 (INDEXSP:.INX).
S&P 500 Futures (ES) – Week 37 (week of September 11)
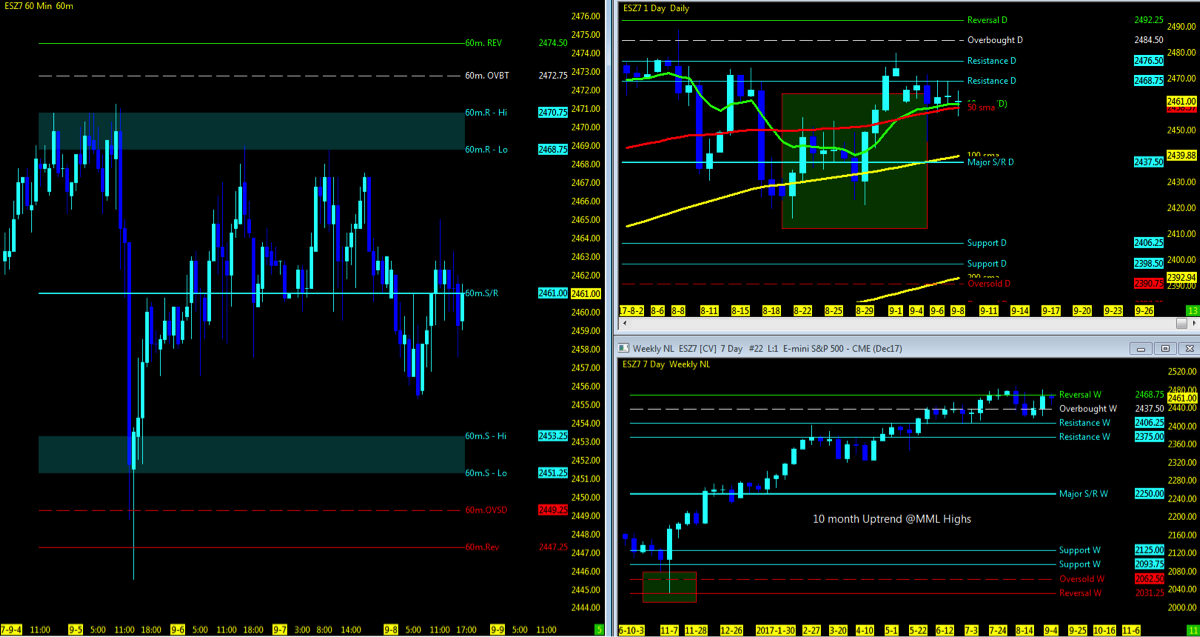
A Note On Using MML Charts: Using the Murray Math Level (MML) charts on higher time frames can be a useful market internal tool as price action moves among fractal levels from hourly to weekly charts. Confluence of levels may be levels of support/resistance or opportunities for a breakout move. Optimal setups will pass through Resistance or Support prior to moving in the opposite trend.
Technical Trends…
- See my Week 36 recap and trend charts
- Stock market indices momentum remains upside
- Consolidation is currently holding above moving averages
- VIX Volatility Index (INDEXCBOE:VIX) falling again
- FANG/FAMMG stocks just off their 52 week high as APPL sitting at all time high
- Stock market indices pulling back off Daily MML Zone High
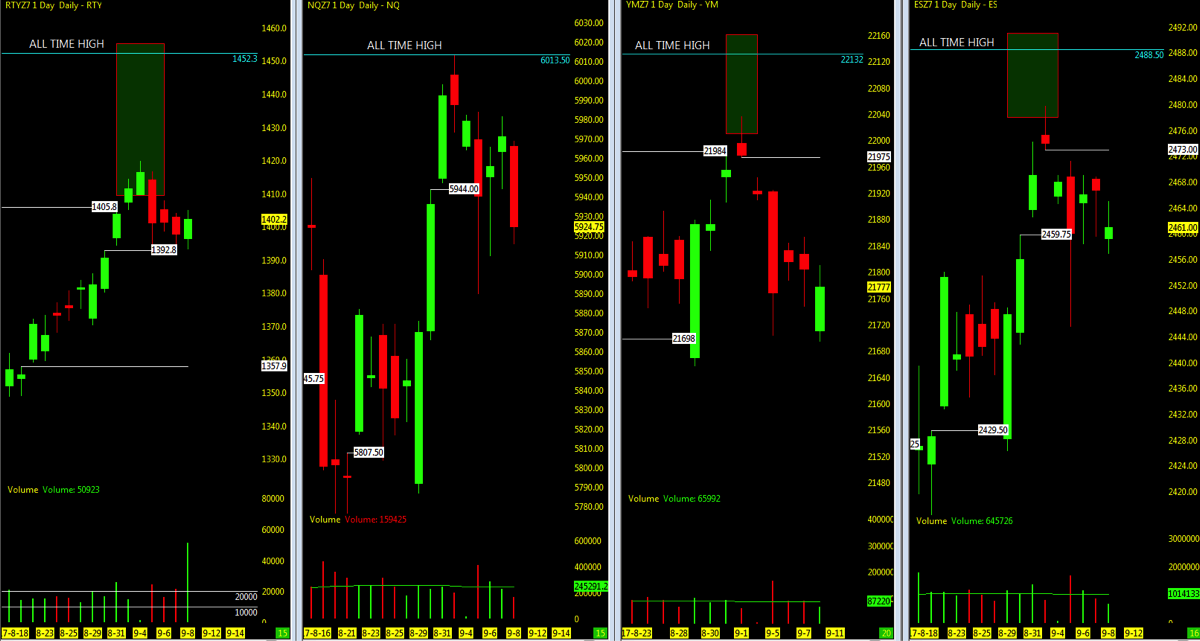
- The Russell 2000 (INDEXRUSSELL:RUT) the exception at 50% major S/R
- S&P 500 futures (ES) and Dow Industrials futures (YM) with nearest open gaps upside (see open gaps chart below)
- Major stock indices moving averages in sync with 10>50>200
- Russell 2000 is the exception 10<50
- RTY/YM/ES momentum divergent of Nasdaq futures (NQ)
- Crude Oil pullback off the 200ma and downside of all key moving averages
- 46.88 break can retest 43.75 level if unable to hold on 60m chart at 47.07- 47.66; 50 target upside
- Daily Gold prices at MML highs
- Holding above 10ema; downside watch MML 50% @1312.5 if it breaks 1343 and the 50ma. Support at 1281.3.
- Current IBD Outlook: Confirmed Uptrend
Key Events in the Market This Week
- Quad Witch, CPI
- OPEC Monthly production report
- Media/Telecom Merger & Acquisitions meeting
- The Apple event
THE BOTTOM LINE
Technical Momentum probability on the indices remains in an UPTREND.
Here we go once again as Quad witch week is upon us and until ALL volume is in the next contract, consolidation seems to be the play until key events play themselves out. Though off the all time highs with no significant pullback at this point to test lower support levels, the momentum in the market on the Total Stock Market index remains up.
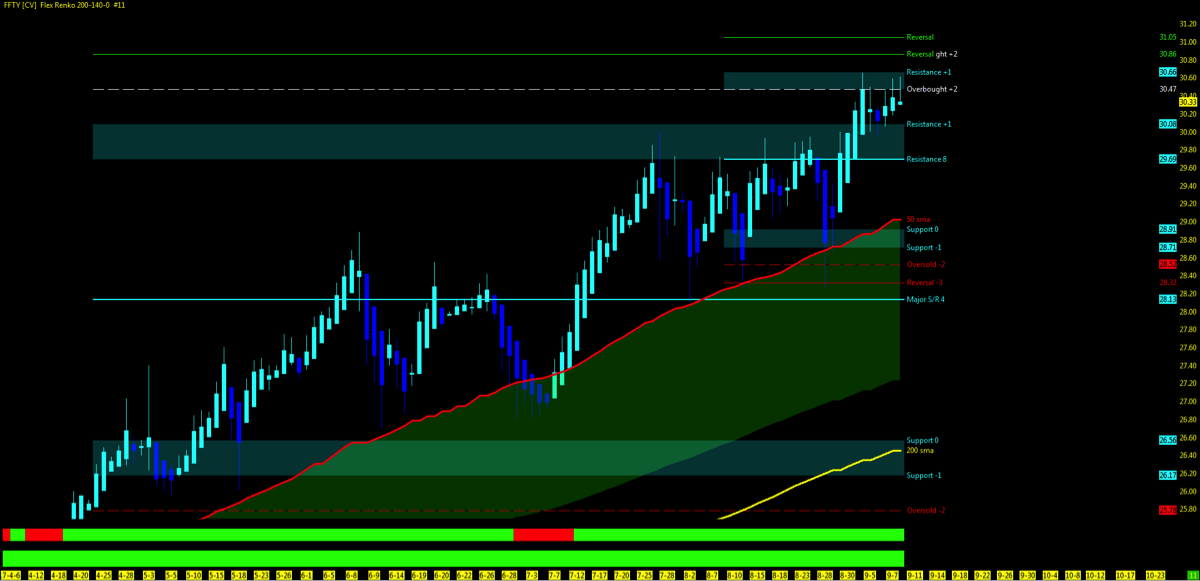
Besides the usual econ data to sway the market in either direction, the upcoming FOMC meeting and Fed Reserve balance sheets unwinding tied in with inflation data seem to be keeping the market at bay and holding pattern. Reward the September bears a bit, while still not pulling back any further. Apple uncertainty on product production may also be a contributing factor. Tax reform; is it going to happen? Surely a deal breaker for the POTUS administration and market momentum. In addition, the IBD 50 ETF (FFTY) which remains in 6 weeks consolidation, a go to index for fundamental strong equities.
While conflicting indicators may show that the sell off is near, there are just as many indicators preparing for a super bullish run. Remain steadfast and patience as the signal for either direction will be evident and sweeping ticks and points for a piece of the momentum is better than being the first one in and the last one out.
By the technicals…
Open Gaps with plenty below remain on all indices with two above and all time highs to watch for. Watch for 2473 open gap upside on the ES if able to hold above 10 and 50 period moving averages. Downside look for 100ma support and MML levels 2437 to 2447. Upside level to watch in the 2475 to 2500 level.
By the Murray Math Levels (MML), which in combo with the T3 strategy has shown what it takes to remain in the trend, surely has been an indicator of choice for key levels to watch for pullbacks and support levels. NQ off the Daily MML high closes below 5937.5 indicating momentum pullback. Watch for the break of the 50ma and support at 5781. RTY which continues to struggle at the 50% MML will look to test 1437 upside and 1375 downside.
Swing ETF positions should be careful about chasing at the highs as pullbacks/quarterly 3sig re-balance are always opportune times to re-enter the trend. Watch for quarterly re-balance in 3 weeks. Stops may be moved to swing low positions if still in for the long trend. No re-entries at this time.
LOWEST OPEN GAPS
- ES: 1589
- NQ: 3864.75
- YM: 14745
Attempting to determine which way a market will go on any given day is merely a guess in which some will get it right and some will get it wrong. Being prepared in either direction intraday for the strongest probable trend is by plotting your longer term charts and utilizing an indicator of choice on the lower time frame to identify the setup and remaining in the trade that much longer. Any chart posted here is merely a snapshot of current technical momentum and not indicative of where price may lead forward.
Thanks for reading and remember to always use a stop at/around key technical trend levels.
Twitter: @TradingFibz
The author trades futures intraday and may have a position in the mentioned securities at the time of publication. Any opinions expressed herein are solely those of the author, and do not in any way represent the views or opinions of any other person or entity.


: Creating Bullish Divergence?")


