THE BIG PICTURE
Stocks are facing an important week ahead. Several major stock market futures indices are nearing decision points so traders need to watch their moving averages for crossovers. Without further adieu, here’s my weekly trading outlook.
S&P 500 Futures (ES) – Macro Outlook – Week 35 (week of August 28)
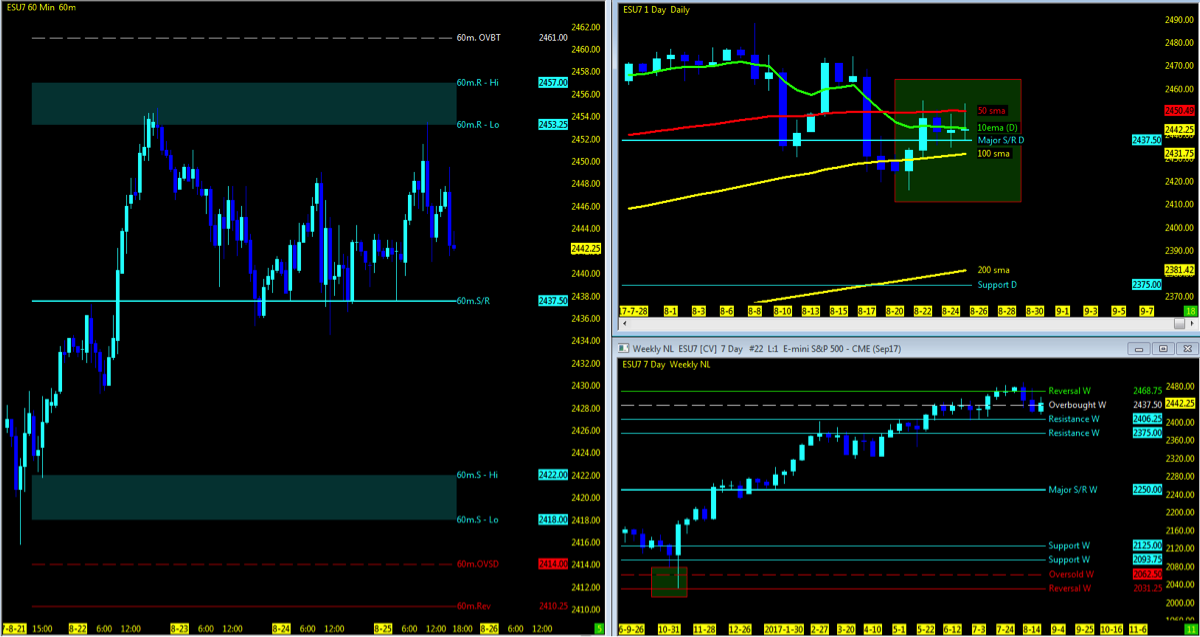
INDEXSP:.INX
A Note On Using MML Charts – Using the Murray Math Level (MML) charts on higher time frames can be a useful market internal tool as price action moves among fractal levels from hourly to weekly charts. Confluence of levels may be levels of support/resistance or opportunities for a breakout move. Optimal setups will pass through Resistance or Support prior to moving in the opposite trend.
Technical Trend…
- See my Week 34 recap and trend charts
- Broad sock market indices finish higher for the week on a gap up Tuesday
- VIX Volatility Index (INDEXCBOE:VIX) holding in the low 11’s
- FANG/FAMMG stocks all off their 52 week high
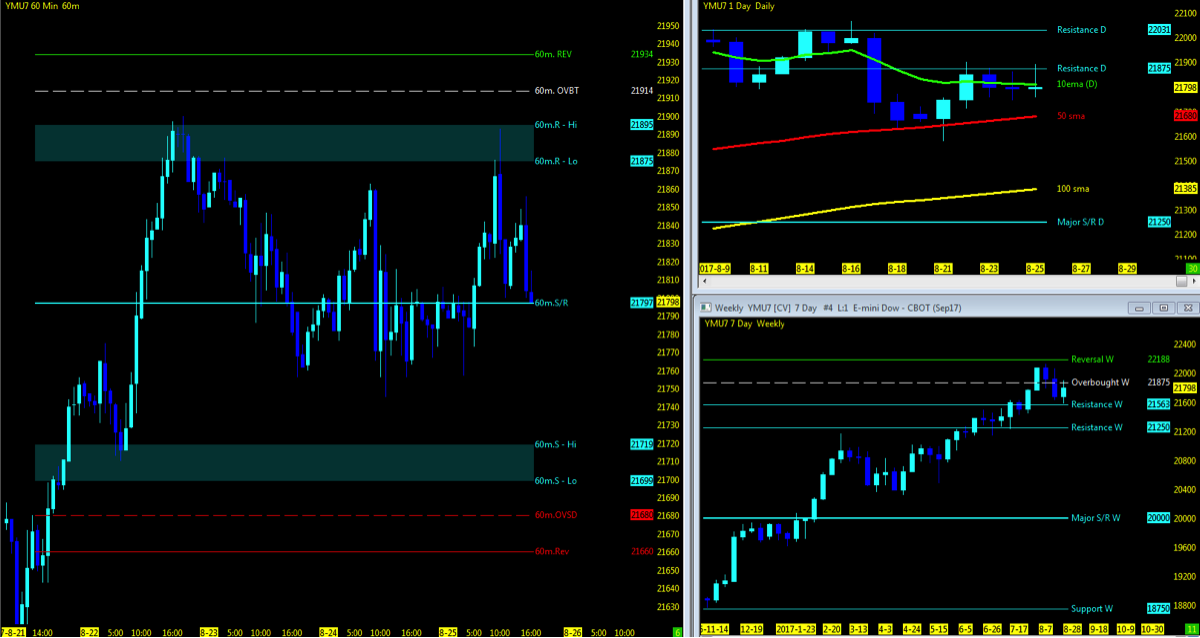
- Stock market indices holding at 60m MML 50% Pullback to Zone High and 10ema
- S&P 500 futures (ES) & Dow Jones Industrials futures (YM) with nearest open gaps downside
- Consolidation of indices major key moving averages
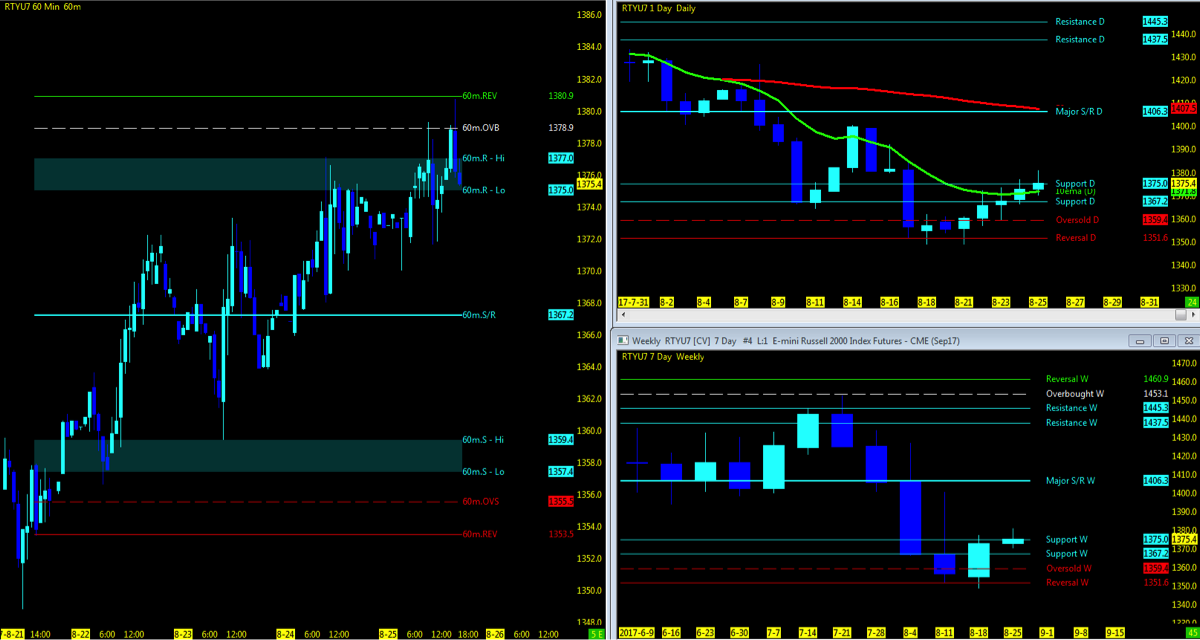
- The Russell 2000 small caps (INDEXRUSSELL:RUT) leading momentum downside pullback off MML Zone low
- WTI Crude Oil trend remains range bound between 50/200 period moving averages at the MML 50% level
- 46.88 break can retest 43.75 level; 50 upside
- Daily Gold futures trading off 7/11 MML lows back upside to MML highs into 11 day consolidation at 1296.9
- Upside break, watch price to hold above 10ema; downside watch 50ma and MML 50% @1250
THE BOTTOM LINE
Technical Momentum probability on the indices remains in an UPTREND with confirmed consolidation.
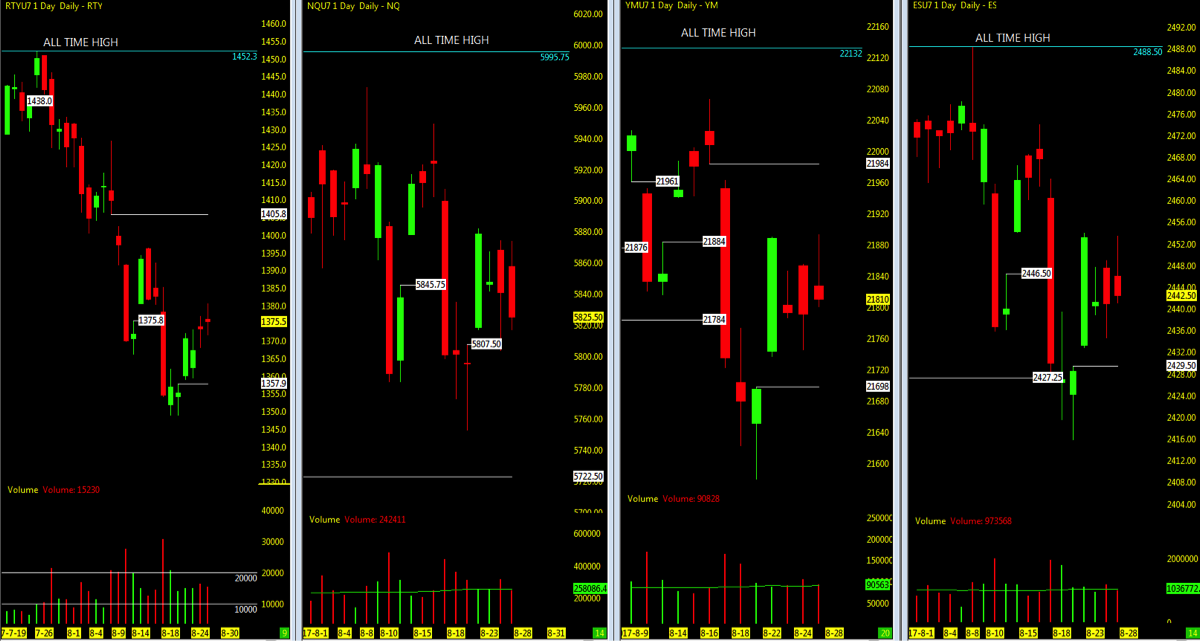
To confirm a downtrend on the bigger picture (daily to weekly), I’m watching for price momentum to lose support off the 10 and 50 day moving averages and the crossing of the 50 day ema over the 144 day ema would confirm a high probability of further selling downside which has yet to occur.
The 200 day moving average which has been catching up to the 50 day moving average leaves markets at a point of not only consolidation but decision time. As long as price remains above the 10 day ema, the short term trend will keep us above the longer term averages which the Dow Jones Industrials futures (YM) and cash (INDEXDJX:.DJI) is the strongest to the upside
And the Russell 2000 (futures and cash index) is the weakest to the downside.
Until that time of the crossover, the momentum remains in nothing more than a cyclical and much needed pullback correction in the market.
Open Gaps below remain on all indices with the Dow Jones Industrials and Russell 2000 upside with all time highs above. Watch for 2429 open gap/100 daily ma on the ES down to MML levels around 2375 which would put the market in the zone of the 200ma; surely a test point. Upside momentum would need to regain traction above the 50ma and back upside to MML highs of last week’s session around 2453. 2500 would be the next upside level to watch. As I said before, consolidation is a decision point and waiting till that breakout may be the best patience.
Watch for payroll and GDP this week and the upcoming contract expiration start to increase the volatility and September FOMC meeting for another possible rate hike to give us a total of three as may be excepted with no guarantees. The ends of summer as August draws out to a close and as fund managers close out the books may give the market the push it needs this week.
Will the small caps keep pushing/holding the market momentum down or the FANG/FAAMG stocks hold us up as they sit not far off from their 52 week highs?
I will notify through social media and my daily outlook; posted 30 minutes prior to the US open of any updates throughout the week.
LOWEST OPEN GAPS
- ES: 1589
- NQ: 3864.75
- YM: 14745
Attempting to determine which way a market will go on any given day is merely a guess in which some will get it right and some will get it wrong. Being prepared in either direction intraday for the strongest probable trend is by plotting your longer term charts and utilizing an indicator of choice on the lower time frame to identify the setup and remaining in the trade that much longer. Any chart posted here is merely a snapshot of current technical momentum and not indicative of where price may lead forward.
Thanks for reading and remember to always use a stop at/around key technical trend levels.
Twitter: @TradingFibz
The author trades futures intraday and may have a position in the mentioned securities at the time of publication. Any opinions expressed herein are solely those of the author, and do not in any way represent the views or opinions of any other person or entity.


