THE BIG PICTURE
The up-trend has been resilient, even as bears try once more for a pullback.
This resiliency is what grinds out market bears. And just when investors begin to find comfort in the easy ride, we get a snap pullback.
There is still a lot of “noise” out there as bulls and bears make their cases for and against equities. As traders, it is wise to follow the price action (and trend indicators) and tune out the noise and opinions.
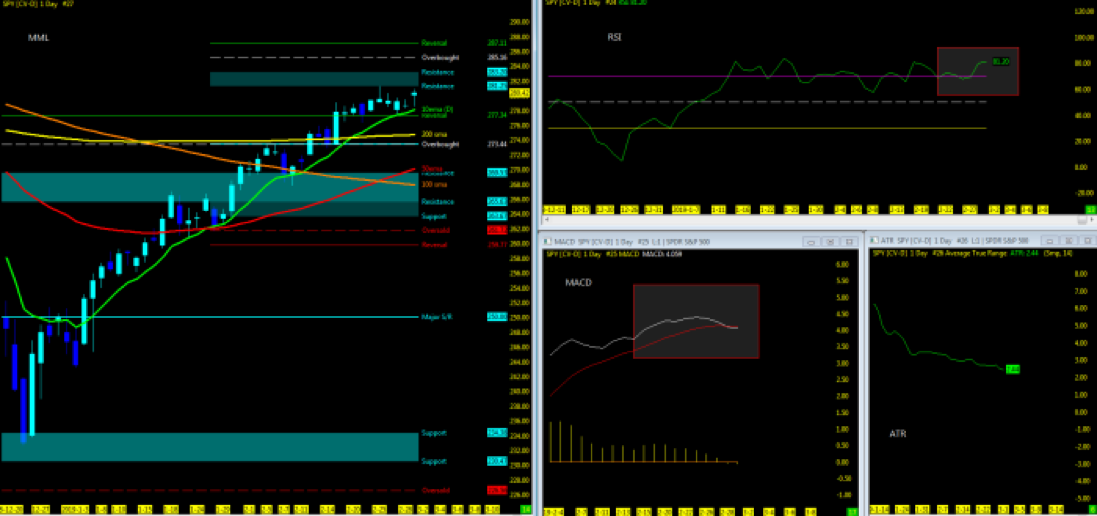
Below is my weekly trading update and stock market trends outlook with a few select charts. Let’s begin today’s update by looking at chart of a broad stock market index, the S&P 500. Below is a chart of the ETF (SPY).
Current Technical Trends – Week of March 4, 2019
Attempting to determine which way a market will go on any given day is merely a guess in which some will get it right and some will get it wrong. Being prepared in either direction intraday for the strongest probable trend is by plotting your longer term charts and utilizing an indicator of choice on the lower time frame to identify the setup and remaining in the trade that much longer. Any chart posted here is merely a snapshot of current technical momentum and not indicative of where price may lead forward.
Market Highlights:
The S&P 500 ETF (SPY) is trading in short term MML range after pullback off 281 resistance
Short term daily range from $269 MML support to $281 resistance
Long Term bounce off support at 234 holding above 277 reversal
Price action above all moving averages
10ema>200sma>50ema>100sma; looking for all in sync for push higher
10 day EMA support since January 4th
Overbought at 81.20 RSI
Average trading range closes out at 2.44
MACD pullback initiated
VIX continues to gradually decline; under 15
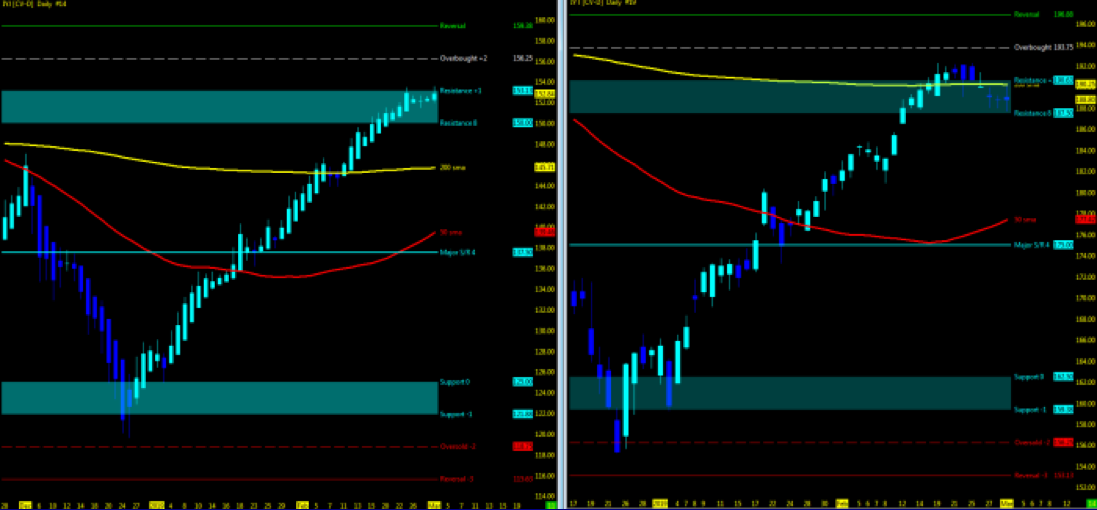
Industrials/Transports
- Monitor for the two ETF indices to remain in sync as supporting indicator of momentum (Up or Down)
- Price action at Daily MML resistance zones
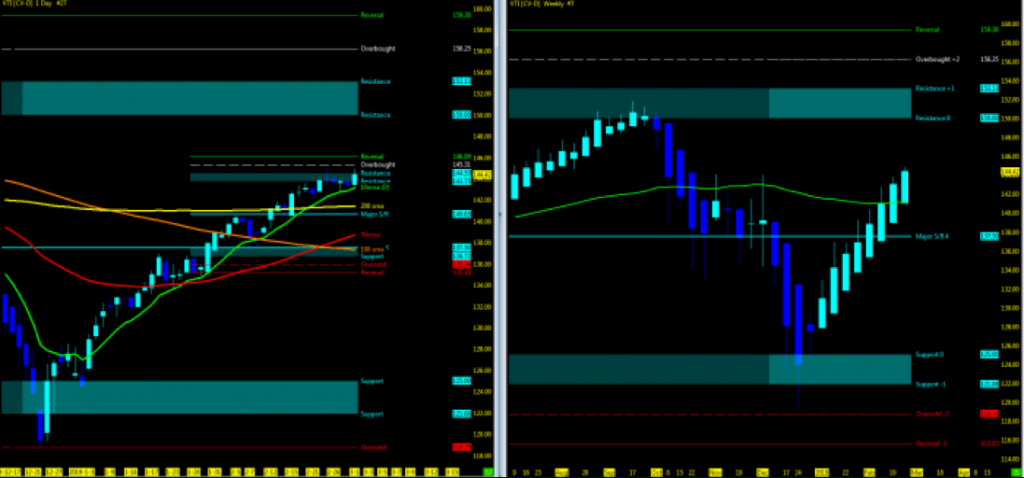
Total Stock Market Momentum – VTI
Current IBD Outlook: Market in Confirmed Uptrend
IBD ETF strategy:100% invested
Current Trend in key ETF Indices may be FOUND HERE
Key Events in the market this week
USA:Employment
Earnings: Costco, Target
Wholesale Chains reports
Futures contract expiry nears
THE BOTTOM LINE
Been a rough ride intraday at the tops but we continue to hold strong off the bounce of end of Q4/2018 at the MML lows on the daily chart. While volume has been hovering around under the 60-day average, the slow steady grind upside is welcome as solid strength x 2 months.
GDP numbers out, employment this week and Brexit deadline this month with upcoming earnings for Q1 in the next month is enough to take us to the next level.
Technically, the momentum remains upside above the 10ema. Watch the 5ema for even shorter support and look for any crossover of the two for pullback opportunities back upside off the MML. Moving averages continue to be out of sync and looking for the 50 to cross above the 200 for even stronger support. MML reset long term will give us our next level upside.
Pullback opportunities back upside off the 200, long term overbought MML levels downside, down to the 50ma and top-level resistance as long as price action remains stable for next move up.
For the intraday trader, both directions offer opportunity. Swing traders, be ready for pullbacks of MML major support off 4-hour charts. Long term, sit quietly and wait to re-balance at lower price at the end of Q3.
Big Picture Market Pulse: With VIX under 15 and back up near short term MML resistance, watch for price action to continue up to short term reversal until we have a mid-term MML reset, monitoring the 5/10 moving averages for a continued move. I believe we are working off overbought conditions before another push higher.
Thanks for reading and remember to always use a stop at/around key technical trend levels.
Twitter: @TradingFibz
The author trades futures intraday and may have a position in the mentioned securities at the time of publication. Any opinions expressed herein are solely those of the author, and do not in any way represent the views or opinions of any other person or entity.

: Worrisome to Broader Market?")


