THE BIG PICTURE
The major stock market indexes recovered from another brief pullback attempt last week and remain in up-trends. Market strength is persisting for longer than most traders have anticipated. This is why the best thing for traders to do is follow the price action and steer clear of the noise. When the market begins a pullback, your process should stop you out of the trade… and/or offer new looks on both the long & short side.
Here’s my weekly stock market futures trading update and trend outlook. We’ll start by taking a look at the S&P 500 (NYSEARCA:SPY).
S&P 500 Chart – Week 50 (week of December 11)
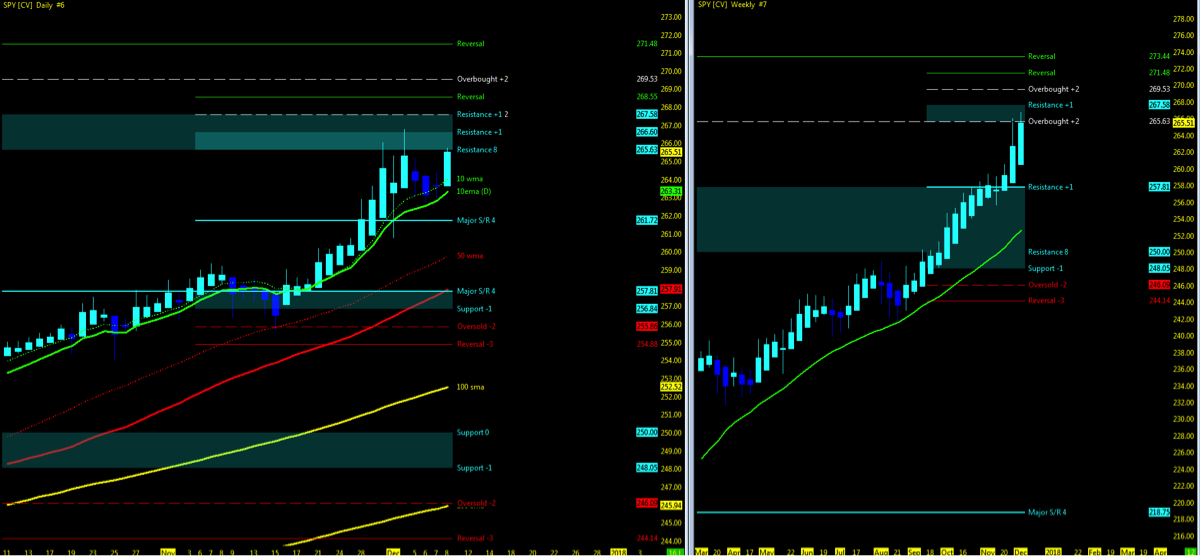
Using the Murray Math Level (MML) charts on higher time frames can be a useful market internal tool as price action moves among fractal levels from hourly to weekly charts. Confluence of levels may be levels of support/resistance or opportunities for a breakout move. Optimal setups will pass through Resistance or Support prior to moving in the opposite trend.
Technical Trends…
- Week 49 recap and trend charts
- Stock market indices pull back off all time highs and regain momentum back upside
- Low volume as quadruple witching week approaches (options)
- Open price gaps remain downside on all 4 stock market indices
- VIX Volatility Index (VIX) levels decrease and holding at mid 9’s
- Industrial/Transports
- Daily HA bars pullback to MML levels and regain momentum upside
- Monitor for the two ETF indices to remain in sync upside as supporting indicator of uptrend momentum
![]()
- FANG/FAAMG represented by the FDN (ETF) in uptrend pullback on weekly Doji HA indecision candle
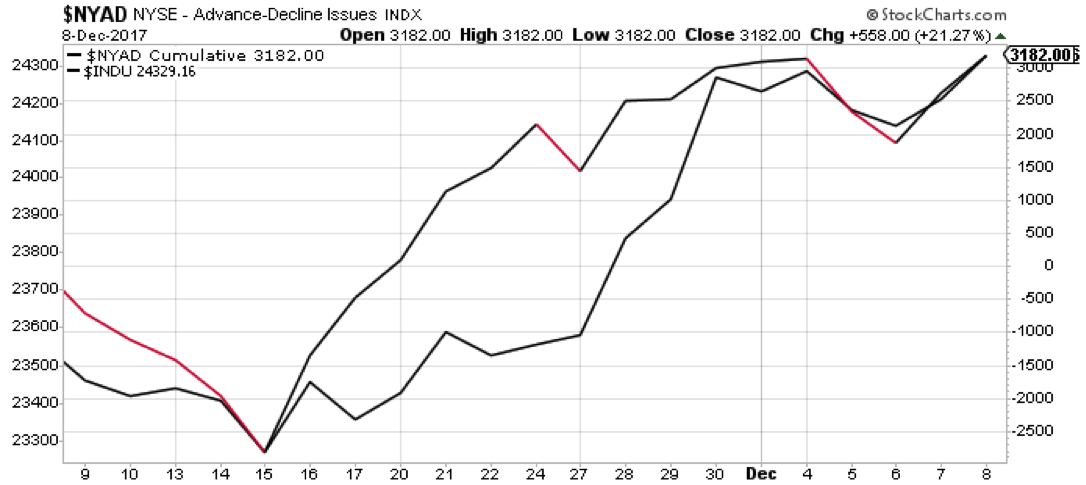
- NYAD (NYSE Advance – Decliners)/INDU in sync upside
You can also view my Market Outlook Video.
Key Events in the Market This Week
- USA: FOMC, PPI, CPI
- GLOBAL: GB-CPI, GB BOE announcement
- Q3 Earnings Season
- Costco
- Quadruple Witching this Friday
- Retail data for November
THE BOTTOM LINE
Uptrend Technical Probability
- Key moving averages in sync on all stock market indices with no crossovers
- Indices remain at all time highs – go higher (IBD motto)
- VIX average though low breaks back down under 9
- IYJ/IYT in sync upside above 10ema
- NYAD/INDU momentum upside
- VTI momentum upside
Downtrend Technical Probability
- UUP – Dollar index momentum BIG PIC downside in an uptrend pullback
- Downside Open Gaps
- Price action pushing at MML high resistance on both long and short term levels
- CANGX pullback now follows with FFTY/VIX pullback
- FDN/TECH struggling to make new all time highs – in consolidation
- FFTY/CANGX pullback off MML Resistance low and under 10/50 ma’s
Big Picture remains upside with indicators leaning to a pullback but until price confirmation is under MML resistance low and moving average crossovers, technical bias heads higher to at least all time highs. With week 49’s sell off understandable from the perspective of end of the year selling, to quickly turn back upside and regain at least 62% of the move downside back up is not a market that is ready for a major correction. Put aside the feelings of where it should go, and by the charts, price is holding strong above key moving averages. Several weeks ago I mentioned that even the possibility of consolidation at the tops here may come in to play as seen in week 49. Some will even relish in the fact that they are calling the tops and they happen to be the same ones that called the top 1/2 a year ago. Wrong again. I don’t see it yet and I’m not subscribing to the “bubble” mania either. As long as econ numbers remain strong, small pullbacks will occur even in an uptrend.
Attempting to determine which way a market will go on any given day is merely a guess in which some will get it right and some will get it wrong. Being prepared in either direction intraday for the strongest probable trend is by plotting your longer term charts and utilizing an indicator of choice on the lower time frame to identify the setup and remaining in the trade that much longer. Any chart posted here is merely a snapshot of current technical momentum and not indicative of where price may lead forward.
Thanks for reading and remember to always use a stop at/around key technical trend levels.
Twitter: @TradingFibz
The author trades futures intraday and may have a position in the mentioned securities at the time of publication. Any opinions expressed herein are solely those of the author, and do not in any way represent the views or opinions of any other person or entity.


