THE BIG PICTURE
Although stocks have been stuck in a range for a few weeks, the major stock market indexes remain in uptrends. We remain overdue for a pullback, so traders should stand at alert. The best thing for traders to do is follow the price action and steer clear of the noise and anticipating the next move. If/When the market begins a pullback, your process should stop you out of the trade… and/or offer new looks on both the long & short side.
Here’s my weekly stock market futures trading update and trend outlook. We’ll start by taking a look at the S&P 500 (NYSEARCA:SPY).
S&P 500 Chart – Week 47 (week of November 20)
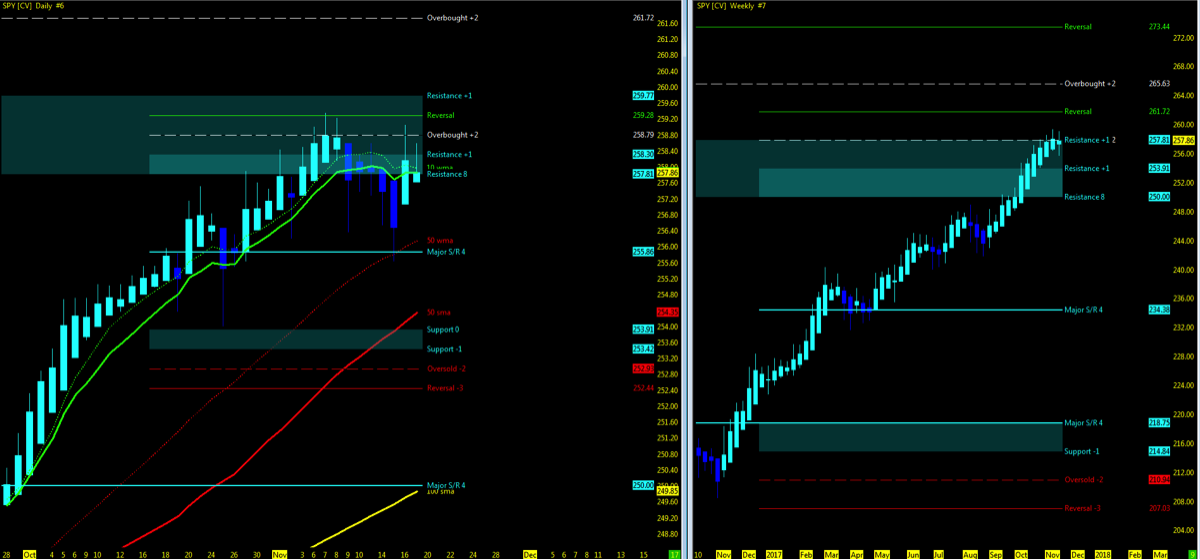
Using the Murray Math Level (MML) charts on higher time frames can be a useful market internal tool as price action moves among fractal levels from hourly to weekly charts. Confluence of levels may be levels of support/resistance or opportunities for a breakout move. Optimal setups will pass through Resistance or Support prior to moving in the opposite trend.
Technical Trends
- Week 46 recap and trend charts
- Nasdaq (INDEXNASDAQ:.IXIC) hits new all time highs
- Russell 2000 (INDEXRUSSELL:RUT) decreases distance from ATH to 26 points from 44
- Open gaps remain downside on all 4 stock market indices
- VIX Volatility Index (INDEXCBOE:VIX) rises to above 11.
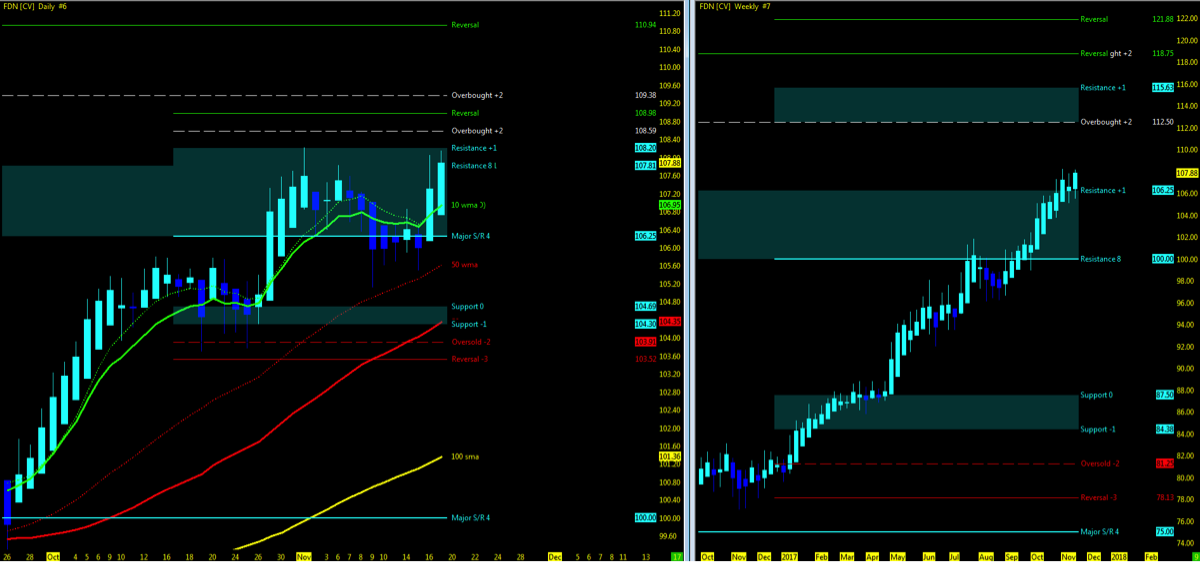
- FANG/FAAMG stocks holding just off 52 week highs; The First Trust Dow Jones Internet ETF (NYSEARCA:FDN) breaks out – see below.
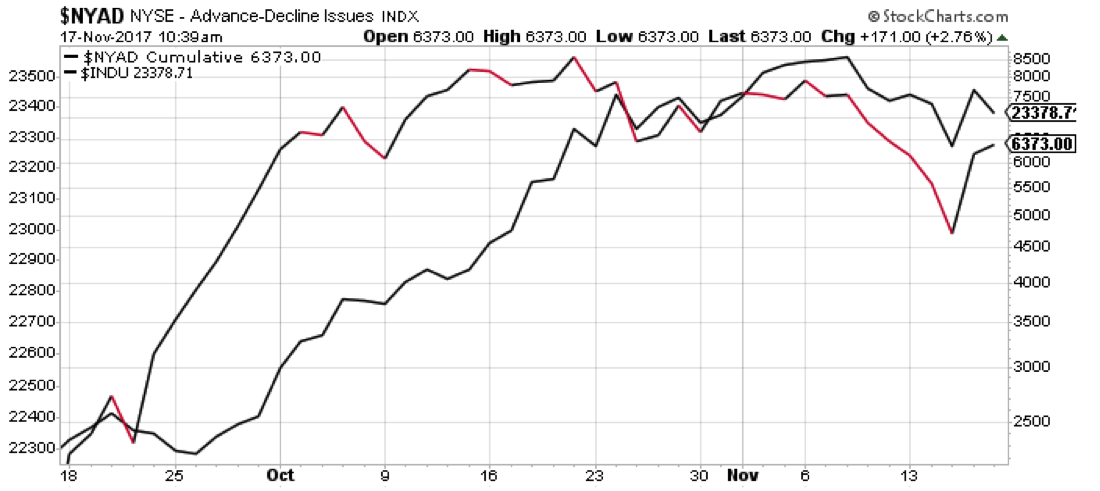
- NYSE Advance – Decliners pull back in sync upside with index
Also check out This Week’s “Market Outlook” VIDEO
Key Events in the Market This Week
- USA: Pre-Holiday session, FOMC minutes, Home Sales, Durable Goods, Consumer Sentiment
- GLOBAL: Britain GDP
- Q4 Earnings Season
- Salesforce, HP, Dollar Tree
Uptrend Technical Probability (considerations)
- Key moving averages in sync on ES/YM/NQ with no crossovers
- VTI/FFTY/CANGX ETF’s momentum remains upside
- UUP – Dollar index pullback
Downtrend Technical Probability (considerations)
- NYAD/INDU momentum leading downside
- Downside Open Gaps
- Indices unable to break clear of short term 10ema/wma
- Price action at MML high resistance
Not much has changed in the scenario from the previous week. The stock indices need to regain clear momentum above the 10 period moving average. If note, the probability of a pullback at this juncture increases. Buy the dip still seems to be the intraday tune of the futures markets. Q3 earnings are giving the markets a lift… with holiday sales the next signal of the economy’s pulse.
Attempting to determine which way a market will go on any given day is merely a guess in which some will get it right and some will get it wrong. Being prepared in either direction intraday for the strongest probable trend is by plotting your longer term charts and utilizing an indicator of choice on the lower time frame to identify the setup and remaining in the trade that much longer. Any chart posted here is merely a snapshot of current technical momentum and not indicative of where price may lead forward.
Thanks for reading and remember to always use a stop at/around key technical trend levels.
Twitter: @TradingFibz
The author trades futures intraday and may have a position in the mentioned securities at the time of publication. Any opinions expressed herein are solely those of the author, and do not in any way represent the views or opinions of any other person or entity.
: Creating Bullish Divergence?")


: Creating Bullish Divergence?")