THE BIG PICTURE
The major stock market indexes remain in uptrends., although they have been wavering of late. Although we remain overdue for a pullback, the best thing for traders to do is follow the price action and avoid getting caught up in the noise and anticipating the next move. If/When the market begins a pullback, your process should stop you out of the trade… and/or offer new looks on both the long & short side.
Here’s my weekly stock market futures trading update and trend outlook. We’ll start by taking a look at the S&P 500 (NYSEARCA:SPY).
S&P 500 Chart – Week 46 (week of November 13)
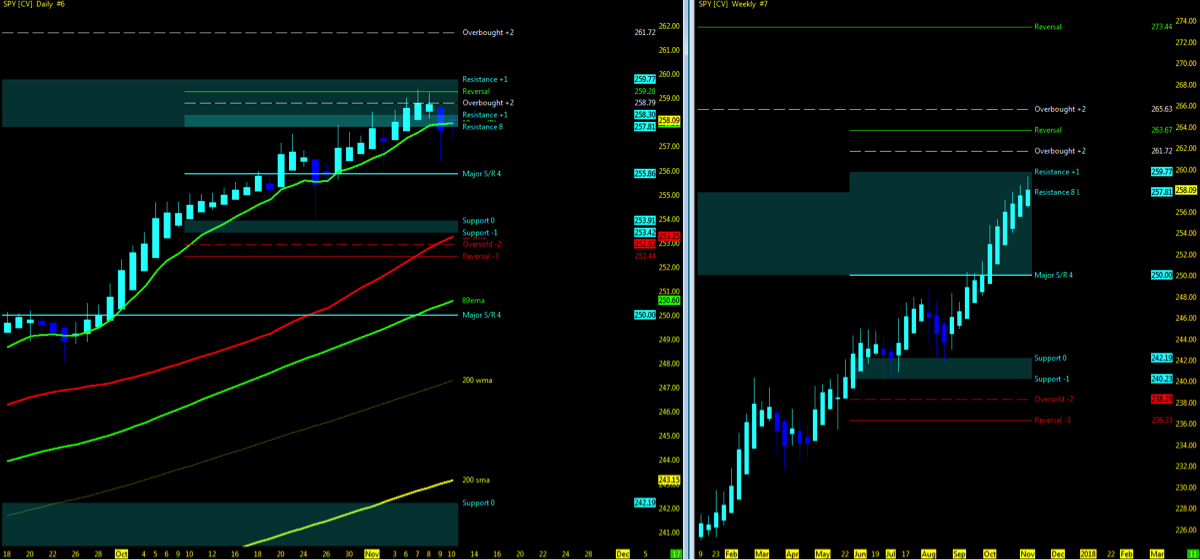
A Note On Using MML Charts: Using the Murray Math Level (MML) charts on higher time frames can be a useful market internal tool as price action moves among fractal levels from hourly to weekly charts. Confluence of levels may be levels of support/resistance or opportunities for a breakout move. Optimal setups will pass through Resistance or Support prior to moving in the opposite trend.
Technical Trends
- Check out my week 45 recap and trend charts
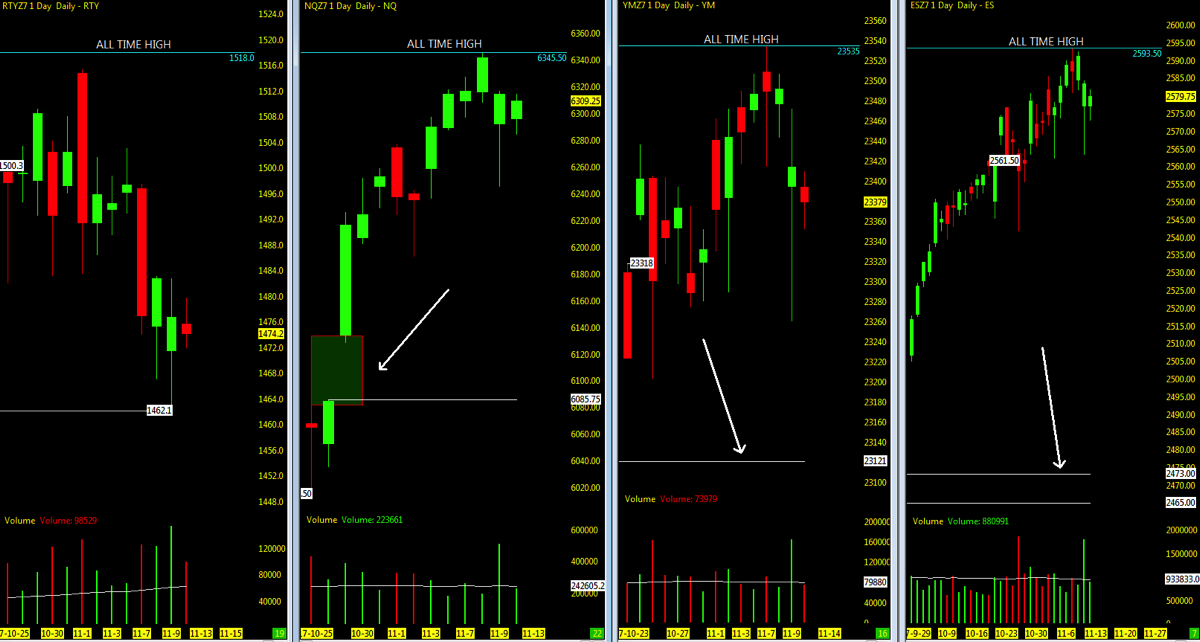
- Nasdaq (NQ), S&P 500 (ES), and Dow futures (YM) momentum pulls back from all time highs
- The Russell 2000 (INDEXRUSSELL:RUT) increases distance downside from ATH to 44 points
- Open gaps remain downside on all 4 indices
- VIX Volatility Index (INDEXCBOE:VIX) moves higher to mid-11 ‘s.
- FANG/FAAMG stocks just off 52 week highs.
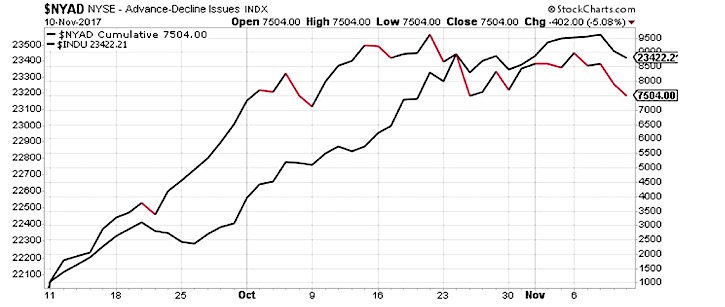
- NYSE Advance – Decline Line pulls back in sync with Dow Jones index (INDEXDJX:.DJI).
Key Events in the Market This Week
- USA: CPI, Fed Speakers
- GLOBAL: Japan GDP
- Q4 Earnings Season
- TGT, WMT, HD, BBY, AMD, CSCO
THE BOTTOM LINE
Uptrend Technical Probability Indicators
- Key moving averages in sync on S&P 500, Dow Jones, and Nasdaq futures with no crossovers.
- Momentum remains upside on major indices and core ETFs.
Downtrend Technical Probability Indicators
- NYAD/INDU Pullback
- Downside open gaps
- RTY leading index momentum down
- NQ at short term 10ema; other indices below
- Price action at MML high resistance
The case can surely be made that more is in favor of a pullback at this juncture in this relentless uptrend. However with companies profiting on Q3 earnings, major buyers supporting the lows of the day sessions and no major geo-political upheaval to turn the direction in the other way, probability remains upside.
Watch for MML setups on price action break above resistance high and back under resistance low for first signs of a pullback. Downside, watch for open gaps to be closed and 50% pullback as 1st level of support.
THE LOWEST OPEN GAPS
- S&P 500 (ES): 1589
- Nasdaq (NQ): 3864.75
- Russell 2000 (RTY): 1462.1
- Dow Jones Industrials (YM): 14745
Attempting to determine which way a market will go on any given day is merely a guess in which some will get it right and some will get it wrong. Being prepared in either direction intraday for the strongest probable trend is by plotting your longer term charts and utilizing an indicator of choice on the lower time frame to identify the setup and remaining in the trade that much longer. Any chart posted here is merely a snapshot of current technical momentum and not indicative of where price may lead forward.
Thanks for reading and remember to always use a stop at/around key technical trend levels.
Twitter: @TradingFibz
The author trades futures intraday and may have a position in the mentioned securities at the time of publication. Any opinions expressed herein are solely those of the author, and do not in any way represent the views or opinions of any other person or entity.


