THE BIG PICTURE
The S&P 500 started 2018 with big gains. All major stock market indices continue to hover near all-time highs and remain in up-trends. Market strength has persisted for much longer than most traders anticipated. This is why traders need to follow the price action (and indicators) and steer clear of the noise. When the market begins a pullback, your process should stop you out of the trade… and/or offer new looks on both the long & short side of trades.
Here’s my weekly stock market futures trading update and trend outlook. Let’s start by looking at a chart of the S&P 500 ETF (SPY).
S&P 500 Chart – Week 52 (week of January 8)
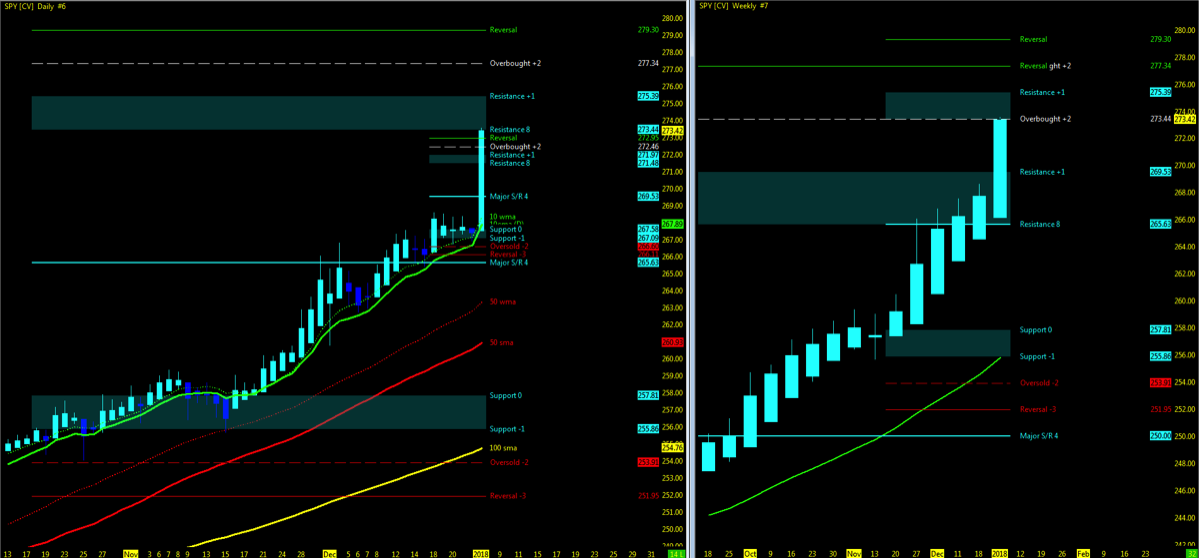
Using the Murray Math Level (MML) charts on higher time frames can be a useful market internal tool as price action moves among fractal levels from hourly to weekly charts. Confluence of levels may be levels of support/resistance or opportunities for a breakout move. Optimal setups will pass through Resistance or Support prior to moving in the opposite trend.
Technical Trends…
- Check Out my week 1 recap and trend charts
- Major stock market indices back to all time highs
- Open Gaps continue to form
- VIX Volatility Index holding at low 9’s
- Dow Industrial/Transports
- Transports holding above 10ma at short term MML resistance; Industrial’s at short term MMl resistance above 10ma
- Monitor for the two ETF indices to remain in sync upside as supporting indicator of uptrend momentum.
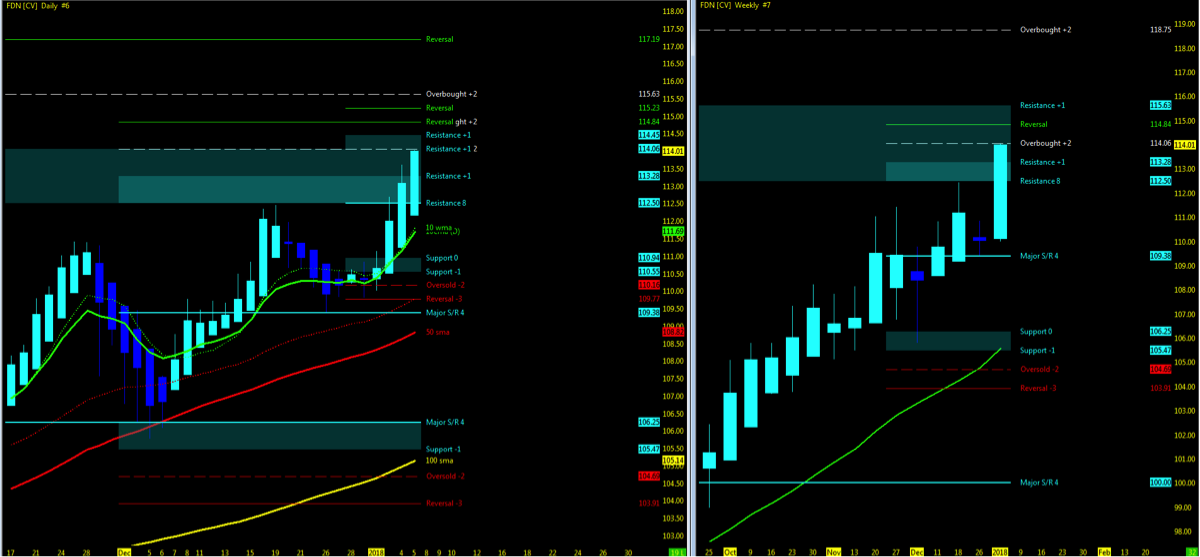
- FANG/FAAMG stocks represented by the FDN (ETF) are pushing price highs on Trending HA bars on both Weekly/Daily
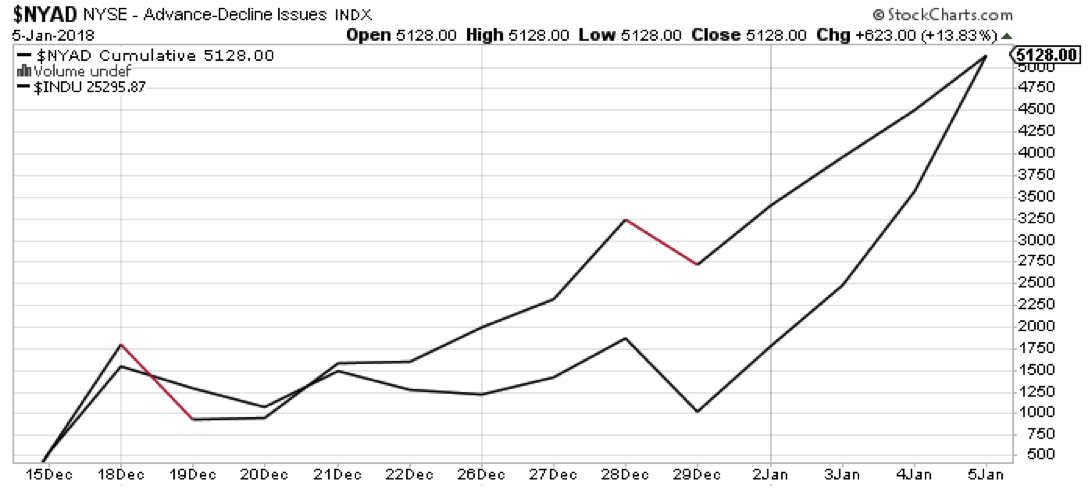
- NYAD (NYSE Advance – Decliners)/INDU in sync upside
Video Outlook: https://youtu.be/lQgGD5dREFU
Markets Covered: ES, YM, NQ, GC, CL
Key Events in the Market This Week
- USA: Consumer Credit, Job Openings, CPI
- GLOBAL: China/India: CPI
- Q4 Earnings:
- Bank stocks – JPM, WFC, PNC
- Delta Airlines
- Blackrock
- Consumer tech show kicks off Tuesday
- Retail sales data for December
THE BOTTOM LINE
Uptrend Technical Probability
- Key moving averages in sync on indices with no crossovers
- Indices remain at all time highs – go higher (IBD motto)
- VIX average low holding under 10
- UUP – Dollar index momentum BIG PIC downside
- FDN (Tech ETF) strong uptrend
- NYAD/INDU momentum upside
- VTI momentum strong upside
- IYJ/IYT in sync upside above 10ema
- Bloomberg Commodity index (BCOM) index has surged by nearly 6% since mid-December (@KennyPolacari)
Downtrend Technical Probability
- Downside Open Gaps
- Price action pushing at MML high resistance on both long and short term levels
- FFTY crawl back to highs – need a breakout to move to Uptrend Probability
- Technical indications (MACD) of an extended market (@EDUCOFIN)
My 3 Cents
…and the tides shift from consolidation/probable pullback to lift off in week one of 2018. Surely that will make the eager long term investor happy as markets push higher. This not the type of start that permabears has in mind for 2018 – the an unprecedented and relentless uptrend continues. They are still waiting for that correction… Reading the Moors and Cabot newsletter put a new perspective in mind. Essentially, the natural disasters we saw in 2017 could be the impetus for increased spending in 2018/2019 to keep the economy on the up and up. Looking ahead to the short term, Q4 data is where my focus will be as all other technical’s keep my probability leveraged to the uptrend.
Watch for MML setups on price action break above resistance high and back under resistance low for first signs of a pullback. Downside, watch for open gaps to be closed and 50% pullback as 1st level of support.
Attempting to determine which way a market will go on any given day is merely a guess in which some will get it right and some will get it wrong. Being prepared in either direction intraday for the strongest probable trend is by plotting your longer term charts and utilizing an indicator of choice on the lower time frame to identify the setup and remaining in the trade that much longer. Any chart posted here is merely a snapshot of current technical momentum and not indicative of where price may lead forward.
Thanks for reading and remember to always use a stop at/around key technical trend levels.
Twitter: @TradingFibz
The author trades futures intraday and may have a position in the mentioned securities at the time of publication. Any opinions expressed herein are solely those of the author, and do not in any way represent the views or opinions of any other person or entity.


