The S&P 500 Index (INDEXSP:.INX) gained 3.3% in the third quarter. Most of the gains occurred early on with stocks struggling to hold the gains in August and September.
This was no small feat given the uncertain backdrop since mid-July that included concerns over the U.S. economy, third quarter profits, oil prices, currency volatility, mixed signals from the Fed and worry that Europe’s banking problems could spread. In addition, stocks faced heavy liquidations from stock funds as individual investors switched to bond funds. Yet, there are reasons for optimism looking further out for stock market trends.
The financial markets received a boost from the Fed that kept interest rates on hold while other central bankers continue to ease aggressively. The fact that the U.S. stock market held steady in the face of a number of potentially punishing issues suggests that the long term path of least resistance remains to the upside. Near term, the markets are likely to continue trading in a narrow range as concerns of weak corporate profits and the election linger.
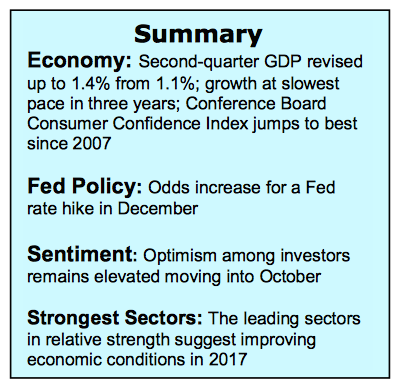
This week’s Labor Department Report due Friday could also keep stocks range bound. Consensus estimates are that the economy gained 175,000 jobs in September. A jobs number significantly above consensus forecast could increase the odds of Fed rate hike in December. Best opportunity for stocks to break out of the current range is likely to come during the final two months of the year.
The technical indicators are mixed, offering little evidence that the start of a year-end rally in imminent. The broad market continues to lose ground with fewer stocks hitting new highs despite the S&P 500 Index a stone’s throw from a new high. The NASDAQ (INDEXNASDAQ:.IXIC), which is loaded with technology stocks, has been the best performer this year.
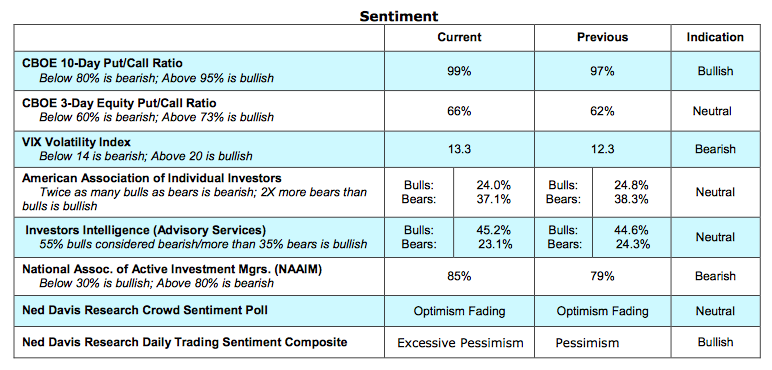
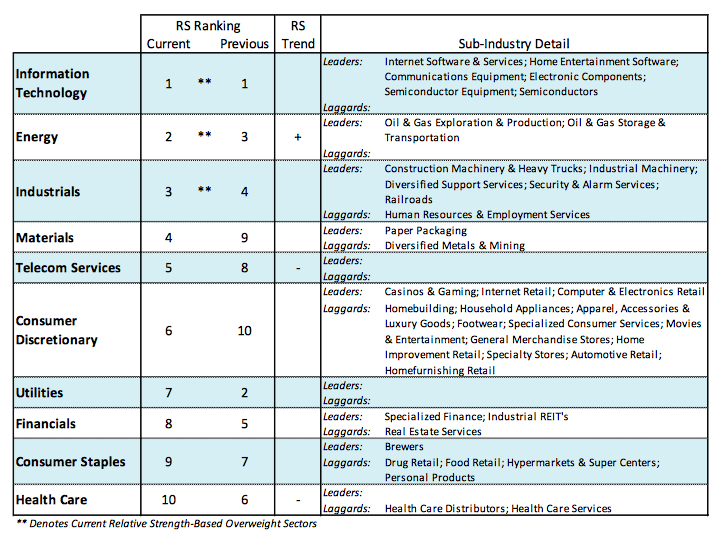
Yet despite this only 50% of issues within the NASDAQ Composite are above their 50-day moving averages. Groups within the S&P 500 that are in bullish uptrends declined last week to 64% from a 2016 high of 84%. Measures of investor sentiment also offer little guidance as to a near-term outlook for stocks. Measures of the individual investor show caution while professional active money managers are bullish. The best rallies in past few years have occurred when the majority was on the same side of the street. Encouragement is found in the makeup of the leading sectors in the market. The fact that the strongest areas are those most closely aligned to the economy could be a signal that better economic conditions are ahead. This is underscored by the Dow Transports that were the strongest area of the market last week and technically in position to establish a bullish uptrend that has been absent the past two years.
Thanks for reading.
Twitter: @WillieDelwiche
Any opinions expressed herein are solely those of the author, and do not in any way represent the views or opinions of any other person or entity.


