S&P 500 Trading Outlook (2-3 Days): BEARISH
The S&P 500 (INDEXSP:.INX) has not yet shown sufficient signs that it should turn down. However, on a 3-5 day basis, a risk-off approach (or pullback) looks like the better risk/reward play than betting on further upside for stocks.
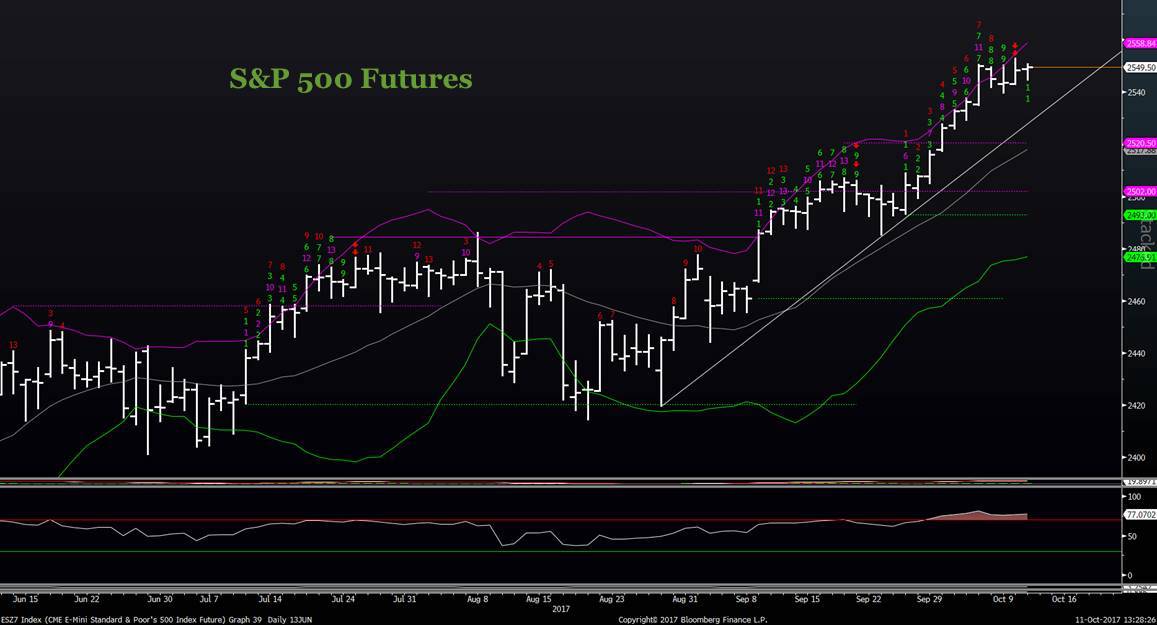
An S&P 500 futures move above 2553 would set up for a final “hurrah” up to 2564-2568 price area, while a move under Monday’s lows of 2539.25 would be important, and negative for the stock market. A move below 2539 would likely signal a pullback.
At present, after 8 straight “UP” days to overbought levels followed by three neutral days, some evidence of turning down is necessary to put the bearish thesis back on the front burner.
S&P 500 Futures Chart
TECHNICAL THOUGHTS
Equities have now gone sideways for three straight days after the initial push-up from late August which coincided with rallies in both Technology and Financials. We’ve seen evidence of the Transportation Avg stalling out after its surge from late August, Financials starting to also falter in severe overbought territory, while Technology appearing to have just put in counter-trend signs of exhaustion on the upside. Now implied volatility is beginning to firm as implied volatility indices like the VIX have held July lows and are starting to show evidence of improving momentum.
Additionally, markets are showing the first signs of Defensive sectors starting to hold their ground and turn higher as seen by Utilities and Consumer Staples outperforming all other 9 major sectors, while Europe has effectively stalled out (SX5E closed up four points from closing levels seven days ago, back on 9/29). Furthermore, risk-off sensitive currencies like the Yen seem to have begun to turn up, as seen by the US Dollar’s lowest close vs the YEN in the month of October, finishing at 102.45. Treasury markets have also shown signs of trying to turn higher in recent days, as seen by both German Bund and US Treasury yields pulling back from levels hit back in late September.
While Risk assets remain within uptrends over the last few weeks, there have at least been introductory signs that all is “not” what it seems. the Advance/decline indicator has begun to show minor negative divergence on daily charts and shows a completed TD Sequential and TD Combo indicators with momentum starting to wane in overbought territory. The next week should provide further evidence whether prices pay any of this any attention and turn lower to combat some of the recent uptick in sentiment while prices struggle to make upward progress amidst a growing number of Counter-trend sells. While a move under 2517 looks necessary to have true concern, a defensive stance is prudent, looking to favor the cautious sectors as risk/reward at these lofty levels looks decidedly sub-par.
If you are an institutional investor and have an interest in seeing timely intra-day market updates on my private twitter feed, please follow @NewtonAdvisors. Also, feel free to send me an email at info@newtonadvisor.com regarding how my Technical work can add alpha to your portfolio management process.
Twitter: @MarkNewtonCMT
Author has positions in mentioned securities at the time of publication. Any opinions expressed herein are solely those of the author, and do not in any way represent the views or opinions of any other person or entity.

 Rolling Over At Key Fibonacci Level?")


 Rolling Over At Key Fibonacci Level?")

