Labor Day is approaching, so it’s time for some fantastic fun, entertainment for everyone, and relaxation. Monday the market is closed in observation of Labor Day.
I have been doing two videos a week along with the written commentary to introduce you to the one index and six sectors of the Modern Family.
This includes the Granddaddy of the U.S. Economy, the Russell 2000.
The family, by design, is U.S.-centric and has been an invaluable resource to tell the story of the economy and the stock market. A link to who the members are and why each is on our website.
This weekend, we are looking at the weekly charts to gain perspective.
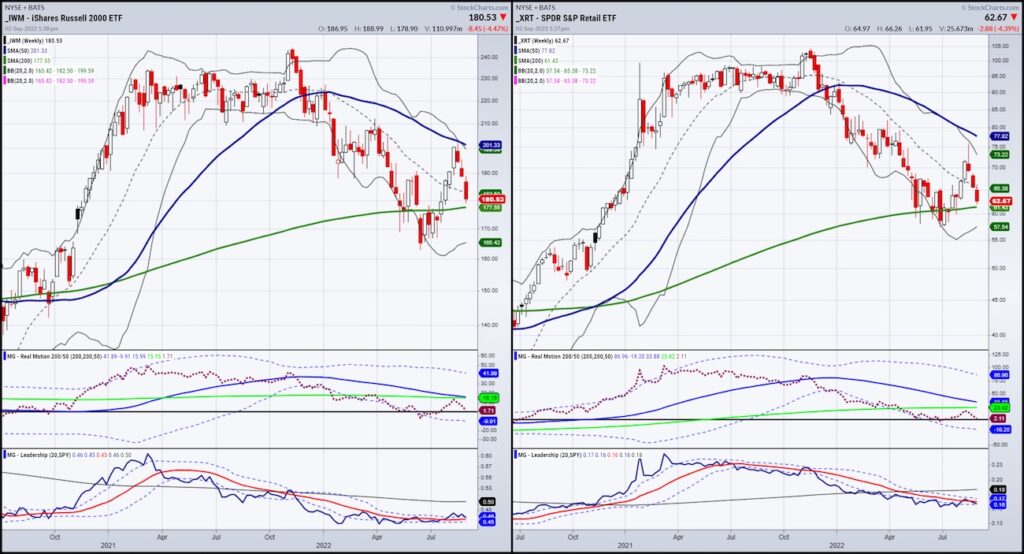
We begin with the Russell 2000 and his wife, Grandma Retail XRT. Both represent demand and supply, focusing on overall consumption and small business activity.
Note how each railed from their June lows, cleared back over their 200-week moving averages, then ran up very close to their 50-week moving averages.
We call this a trading range, and as such has been the strategy we have employed. Currently buying weakness and selling strength at turning points yields profits.
IWM and XRT have sold off hard since Jackson Hole. They both now approach their 200-WMAs.
That makes the story clear. Should they hold, up we go. Should they fail those critical green lines, expect another leg lower.
Only 5% of Americans have adjusted their portfolios in 2022 in their 401(k)s and 403 (b)s.
Our biggest concern is at what point does the pain get too hard to deal with and we see massive liquidation?
Well, we’d rather be prepared and have a plan. Nonetheless, there are pockets of the market and within the family that are doing better than the others.
Let’s examine these charts as well.
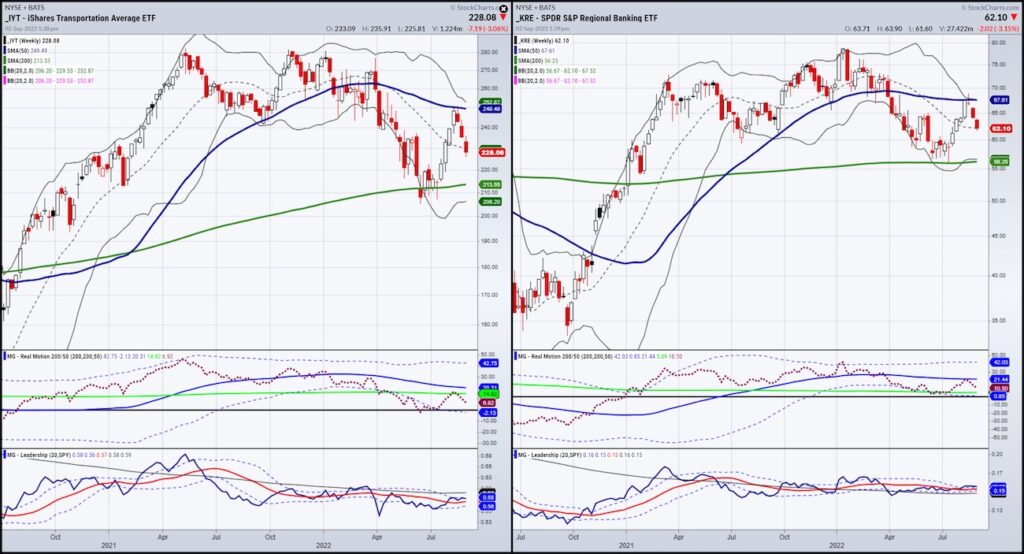
The following two charts are Transportation (Trans IYT) and Regional Banks (our Prodigal Son KRE).
We grouped them because they have sold off but are holding well above their 200-WMAs, given each relative strength.
This tells us that, although weaker, demand from delivery, travel and banking gives us a glimmer of hope that things aren’t as bad as folks think.
Plus, it supports our stagflation theory, where the economy is stagnating but not necessarily collapsing.
At least not yet.
Plus, it supports our stagflation theory, where the economy is stagnating but not necessarily collapsing. At least not yet.
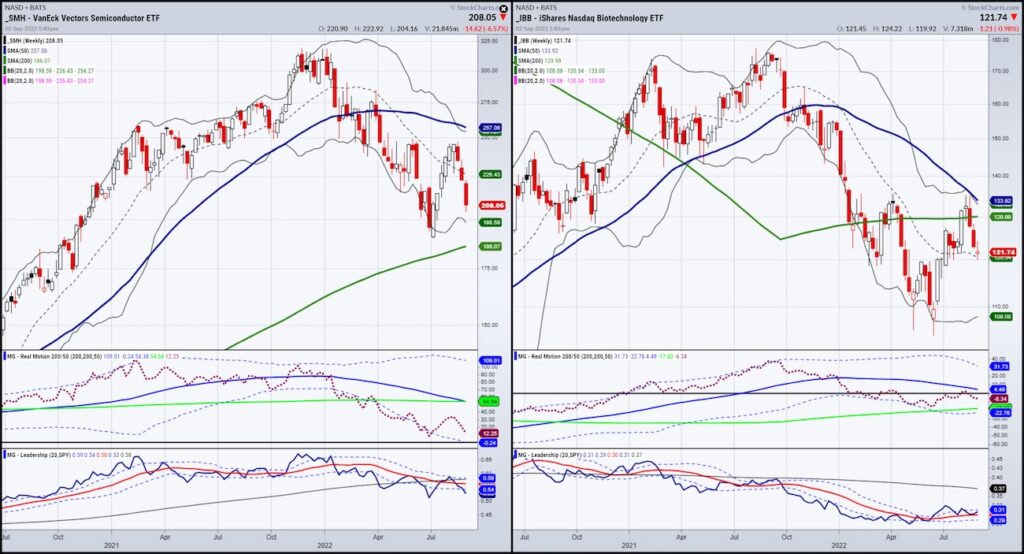
The last two members are more speculative in nature.
Sister Semiconductors (SMH), although in better shape than Granny and Gramps, on a daily chart basis, needs to hold 200.
If that level breaks, then we are looking at that 200-WMA at 186-187.
Big brother Biotechnology (IBB) is technically the weakest one of all the family members. Already priced under both the 50 and 200-WMAs, we see 118, or the early 2022 lows as the first level to hold. If that break, 110 could be the next stop of support.
If you put this all together, no doubt this market could be in for more trouble. However, never discount these weekly support levels.
Be open minded, keep the noise down in your head, and follow price.
The Family and the stock market is forward thinking. We never really know what lies ahead. Therefore, keep the Economic Family in your toolbox, and let them and the charts help you navigate your next trades.
To learn more about how to invest in profitable sectors of the Modern Family, reach out via chat, phone, email, or book a call with Rob Quinn, our Chief Strategy Consultant, by clicking here.
Mish’s Upcoming Seminars
ChartCon 2022 Stockcharts October 7-8th Seattle.
Join me and 16 other elite market experts for live trading rooms, fireside chats, and panel discussions
The Money Show
Join me and many wonderful speakers at the Money Show in Orlando beginning October 30th running thru November 1st-Spend Halloween with us! And this weekend is a special discount code to save $$$:
Stock Market ETFs Trading Analysis & Summary:
S&P 500 (SPY) 390 support held-400 level failed
Russell 2000 (IWM) Needs to clear 184.25 hold 177
Dow Jones Industrials (DIA) Closed weak under support. 312 key
Nasdaq (QQQ) Either climbs back over 296 or more pain to 280
KRE (Regional Banks) Unconfirmed bearish phase w/ close under the 50-DMA
SMH (Semiconductors) 215 resistance and 205 support
IYT (Transportation) Unconfirmed bearish phase w/ close under the 50-DMA-if fails more Tuesday, pain
IBB (Biotechnology)125 resistance 117 support
XRT (Retail) 64.50 resistance and 62.00 6-month calendar range hi support-which held-at least one hopeful sign
Twitter: @marketminute
The author may have a position in mentioned securities at the time of publication. Any opinions expressed herein are solely those of the author and do not represent the views or opinions of any other person or entity.


 Ready To Break Out?")

 Rolling Over At Key Fibonacci Level?")