The major stock market indices are trading lower this morning as yesterday’s mini reversal follows through.
Value buyers should show up at lower levels, but it is the retests that we will watch to determine the character of this pullback.
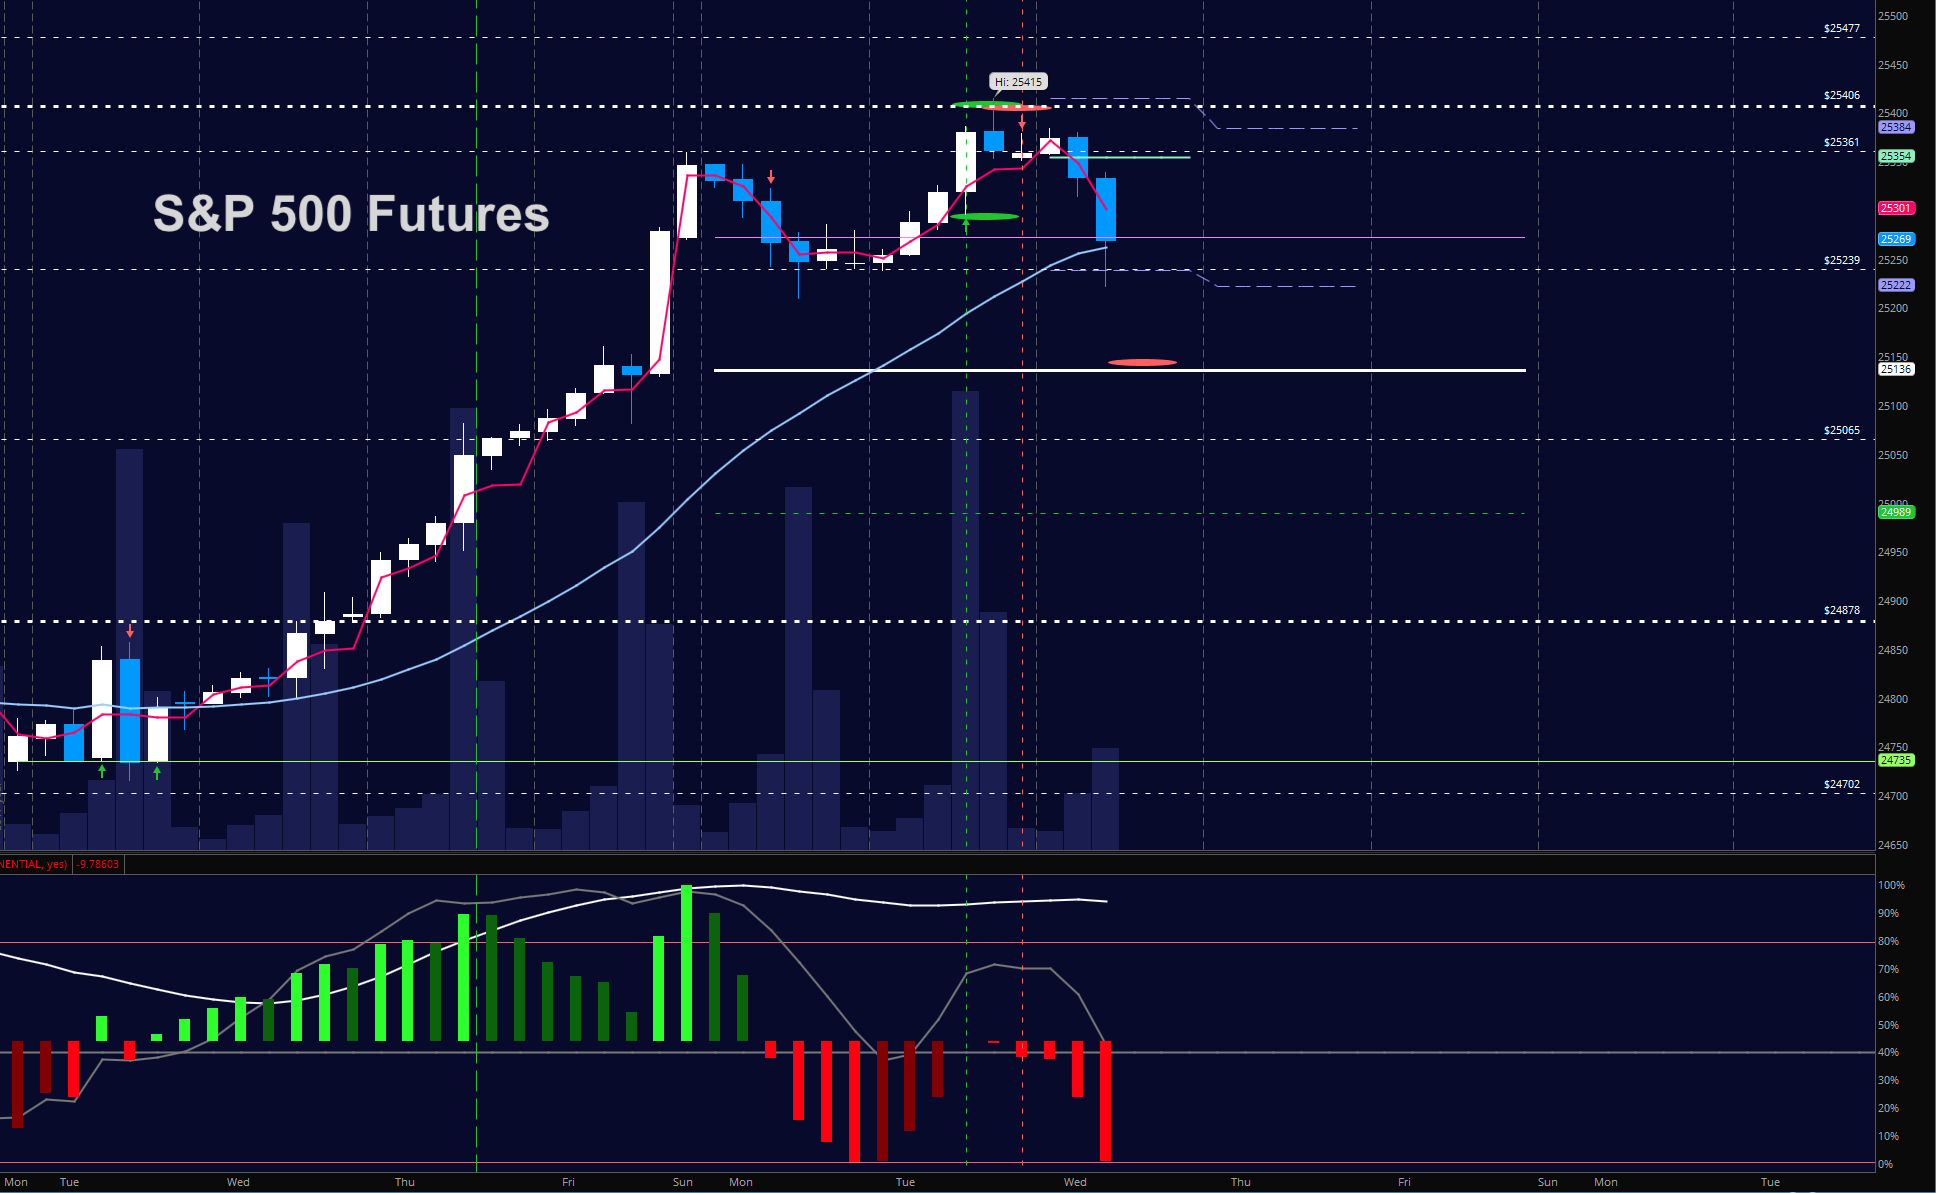
S&P 500 Futures Trading Considerations For January 10, 2018
True to form, staying long after hearing news of a lack of insurance purchased in the form of puts was not quite the best course of action here. As long as we stay below 2746 we run the risk of further downside. Support remains near the familiar 2736. Short trades still be swift but watch for lower highs if momentum begins to hold negative. At present, it still holds steady and bullish on longer time frames meaning that fades will be met by value buyers again. The bullets below represent the likely shift of trading momentum at the positive or failed retests at the levels noted.
- Buying pressure intraday will likely strengthen with a positive retest of 2748.5
- Selling pressure intraday will likely strengthen with a failed retest of 2736
- Resistance sits near 2742.5 to 2747.25, with 2751.25 and 2758.75 above that.
- Support holds between 2737.5 and 2732.5, with 2726.25 and 2712.25 below that.
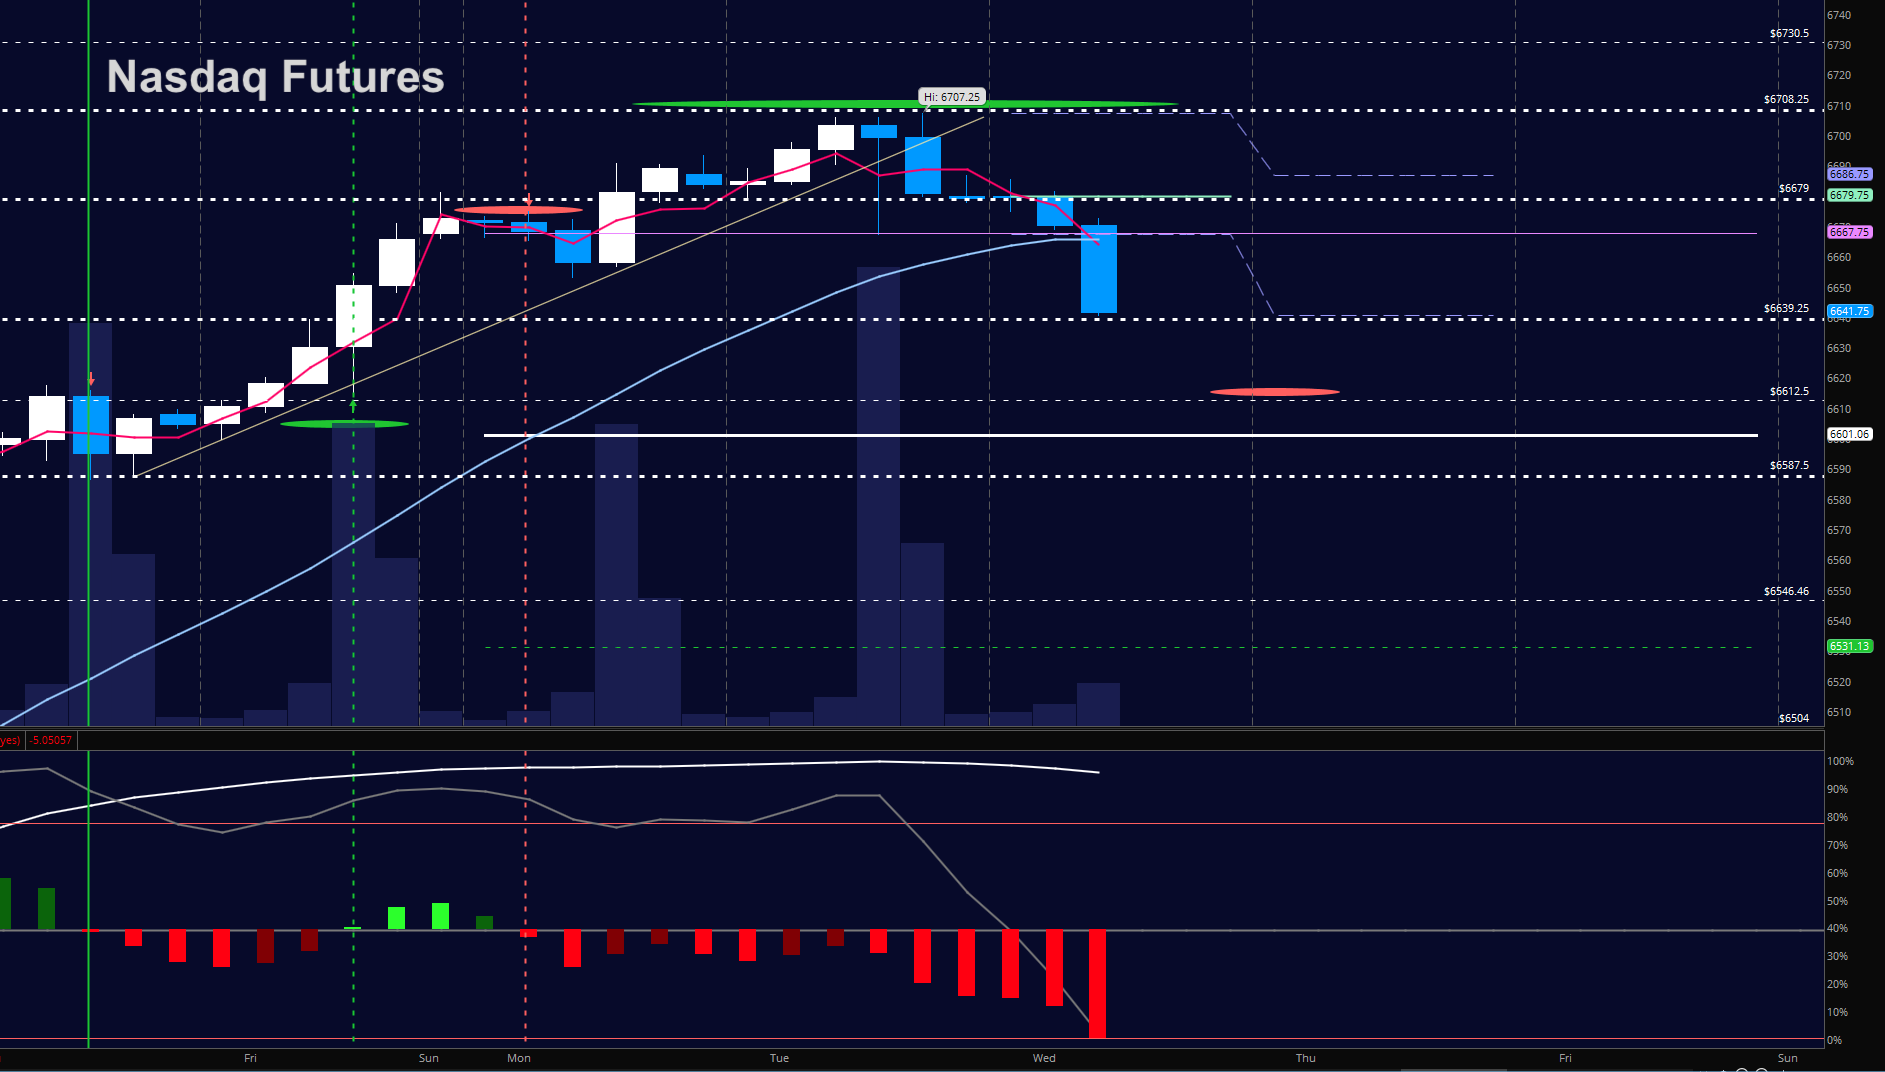
NASDAQ Futures
In a show of some weakness the NQ faded into deeper support – not quite getting to our support level of 6627.5 shown in yesterday’s targets but a loss of 6639 will bring that into view. We did have the break of that rising wedge from yesterday but again – the level to hold today is that 6639 for buyers to have a shot at further recovery into 6680 or so ( yesterday’s support level). The bullets below represent the likely shift of intraday trading momentum at the positive or failed tests at the levels noted.
- Buying pressure intraday will likely strengthen with a positive retest of 6680.75
- Selling pressure intraday will likely strengthen with a failed retest of 6638.75
- Resistance sits near 6680.5 to 6686.75 with 6696.5 and 6730.75 above that.
- Support holds near 6639 and 6627.75, with 6614.5 and 6588.5 below that.
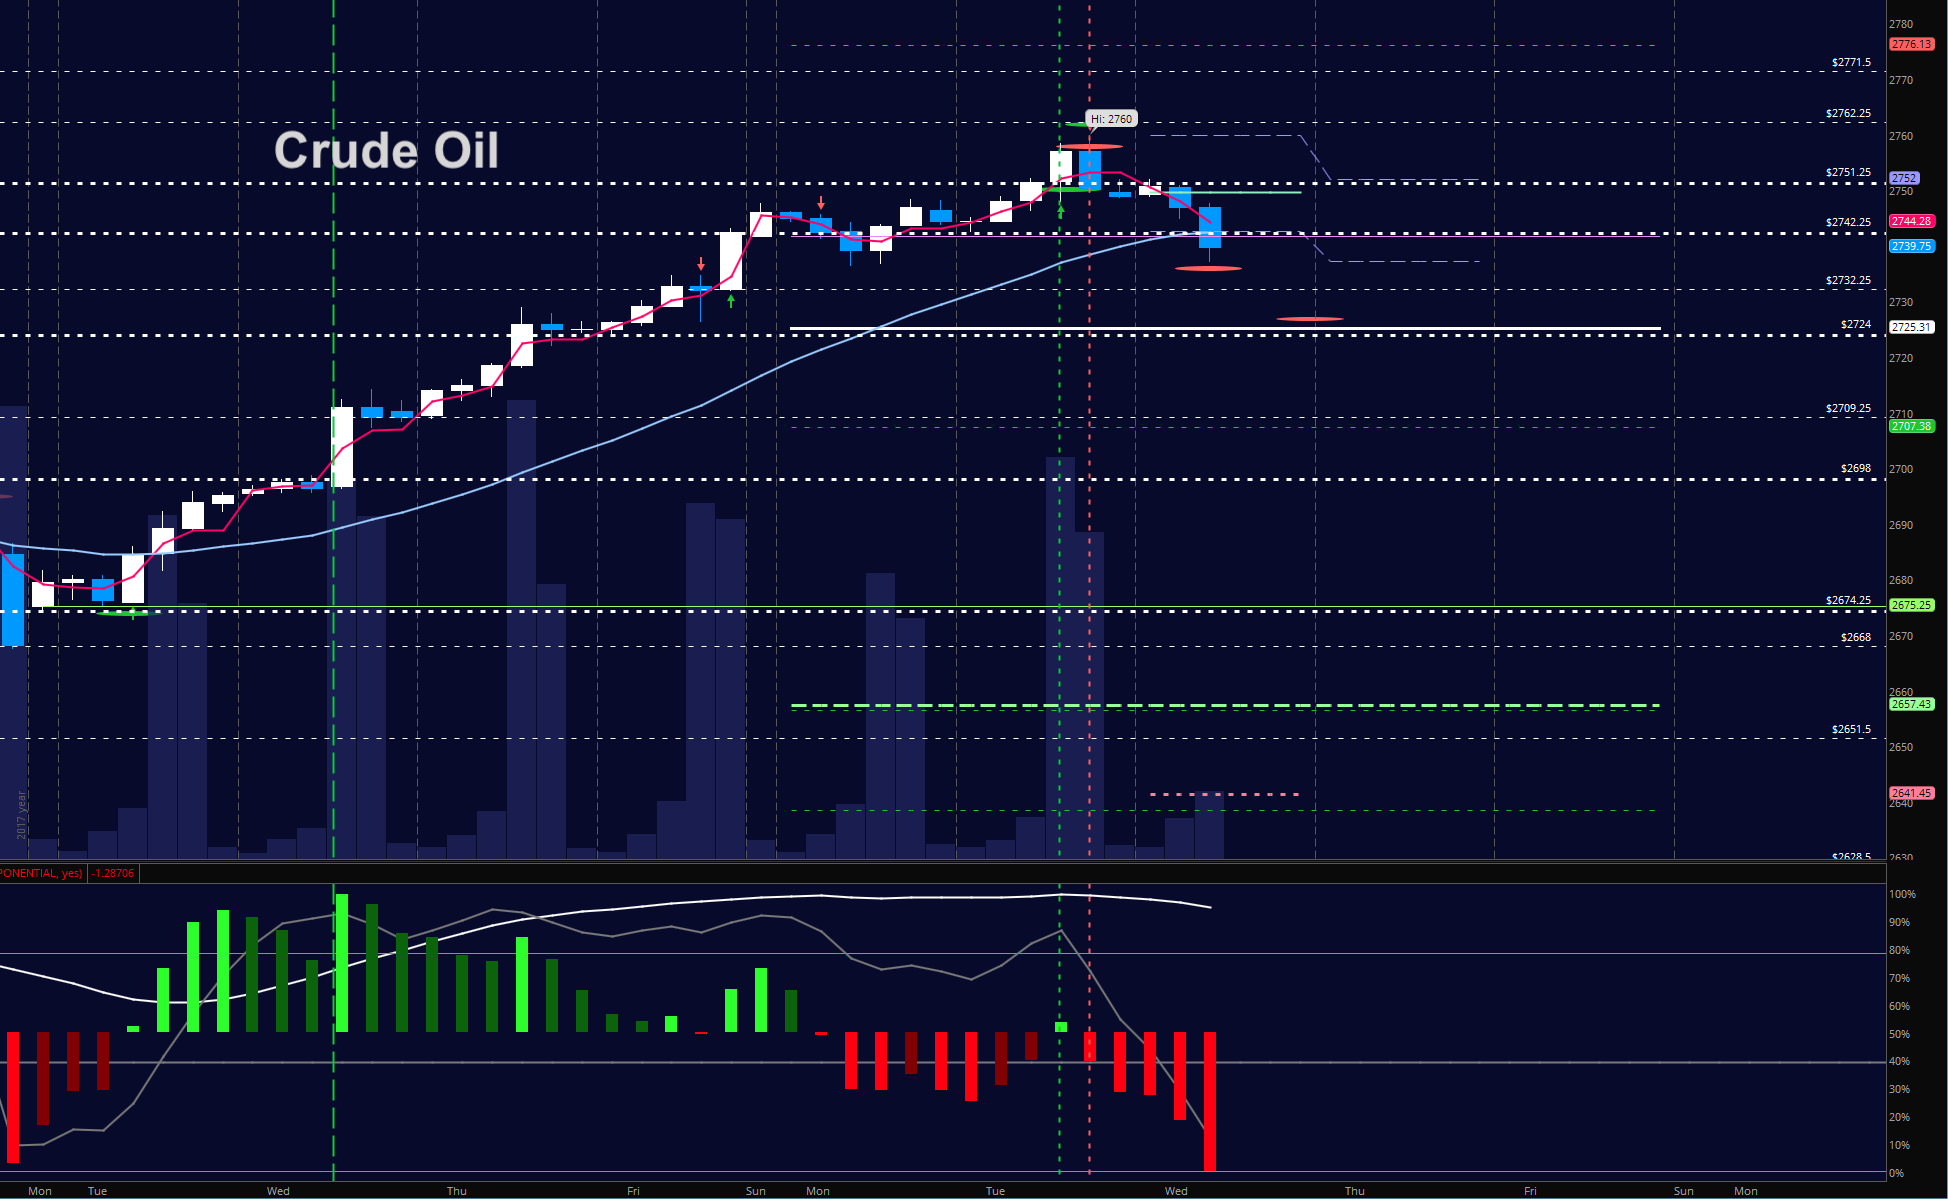
WTI Crude Oil
Traders hold their bullish stance for another day as we test just shy of yesterday’s target level of 63.7. As mentioned, 65.4 is quite likely on the horizon but with tests of 64.5 to breach being important. The key level for buyers to hold sits near 63.3 as we have the EIA report today. The bullets below represent the likely shift of trading momentum at the positive or failed tests at the levels noted.
- Buying pressure intraday will likely strengthen with a positive retest of 63.7
- Selling pressure intraday will strengthen with a failed retest of 63.27
- Resistance sits near 63.7 to 64.15, with 64.53 and 65.4 above that.
- Support holds near 62.3 to 62.04, with 61.77 and 61.3 below that.
If you’re interested in the live trading room, it is now primarily stock market futures content, though we do track heavily traded stocks and their likely daily trajectories as well – we begin at 9am with a morning report and likely chart movements along with trade setups for the day.
As long as the trader keeps himself aware of support and resistance levels, risk can be very adequately managed to play in either direction as bottom picking remains a behavior pattern that is developing with value buyers and speculative traders.
Twitter: @AnneMarieTrades
The author trades stock market futures every day and may have a position in mentioned securities at the time of publication. Any opinions expressed herein are solely those of the author, and do not in any way represent the views or opinions of any other person or entity.


